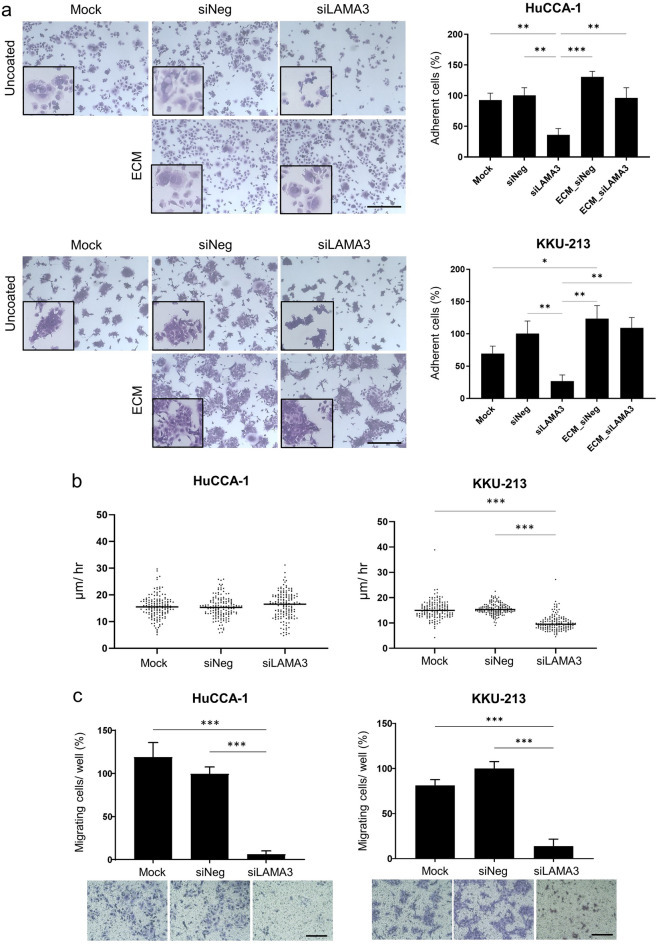
Figure 6.
Reduction of CCA cell adhesion and migration in LAMA3-silenced cells. (a) Cell adherent area analyzed by Image J (right). Data present as mean ± SEM in percent relative to those of the siNeg from three independent experiments. Representative crystal violet staining of adherent cells under 10 × magnification and the inserts represent enlarge areas (left). Scale bar: 40 µm. ECM: mock-decellularized ECM-coated plate. (b) Migration speed of CCA cells collected by cell tracking in time-lapse every 15 min for 12 h. Data from one representative experiment were shown in dot plots, in which individual dots represent the average migration speed (µm/hour) per area (n = 150). (c) Cell migration examined by the transwell assay. Graphs were created using Graphpad Prism. *P < 0.05, **P < 0.01, ***P < 0.001.

