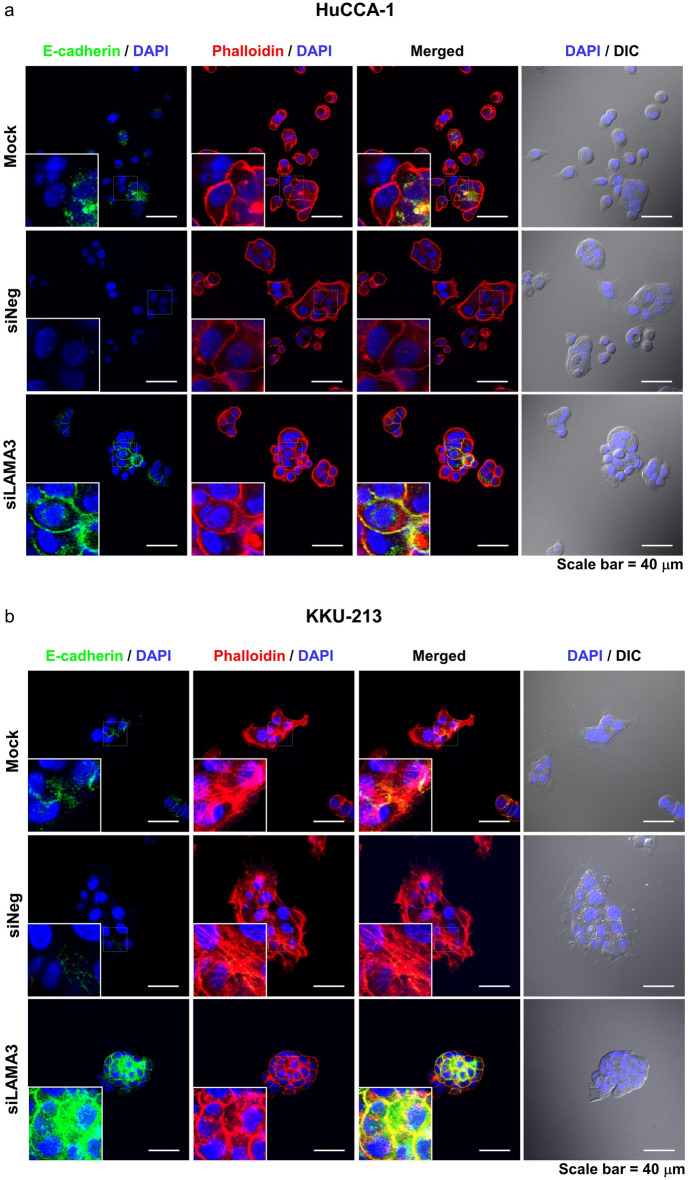
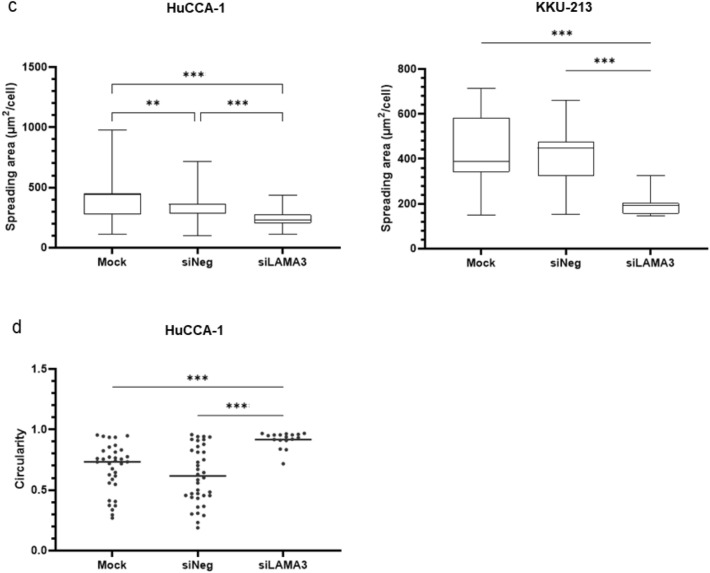
Figure 8.
Alteration of E-cadherin and F-actin distribution and shrinkage of cell spreading area in CCA cells upon LAMA3 knockdown. Forty-eight-hr LAMA3-silenced cells were reseeded for 24 h before immunofluorescent staining. (a,b) Immunofluorescent images showed localization and distribution of E-cadherin protein (green), F-actin (using phalloidin staining, red), and nuclei (Hoechst staining, blue). (a) HuCCA-1; (b) KKU-213; scale bar: 40 µm. (c) The cell size in the unit area (μm2/cell) and (d) cell circularity was measured from phalloidin staining. Data from one representative experiment were shown in box plots. The value close to one indicates high circularity. (cell spreading: n > 40, circularity = n > 15). Images were captured from FV1000. **P < 0.01, ***P < 0.001.


