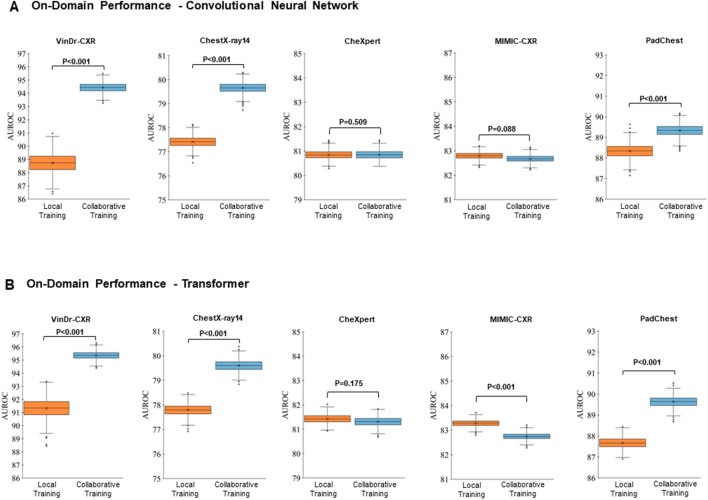
Figure 2.
On-domain Evaluation of Performance—Averaged Over All Imaging Findings. The results are represented as the area under the receiver operating characteristic curve (AUROC) values averaged over all labeled imaging findings, i.e., cardiomegaly, pleural effusion, pneumonia, atelectasis, consolidation, and pneumothorax, and no abnormalities. “Local Training” (first column, orange) indicates the AUROC values when trained on-domain and locally. “Collaborative Training” (second column, light blue) indicates the corresponding AUROC values when trained on-domain yet collaboratively while including the other datasets (federated learning) as well. The datasets are VinDr-CXR, ChestX-ray14, CheXpert, MIMIC-CXR, and PadChest, with training datasets totaling n = 15,000, n = 86,524, n = 128,356, n = 170,153, and n = 88,480 chest radiographs, respectively, and test datasets of n = 3,000, n = 25,596, n = 39,824, n = 43,768, and n = 22,045 chest radiographs, respectively. (A) Performance of the ResNet50 architecture, a convolutional neural network. (B) Performance of the ViT, a vision transformer. Crosses indicate means, boxes indicate the ranges (first [Q1] to third [Q3] quartile), with the central line representing the median (second quartile [Q2]), whiskers indicate minimum and maximum values, and outliers are indicated with dots. Differences between locally and collaboratively trained models were assessed for statistical significance using bootstrapping, and p-values are indicated.

