Figure 2:

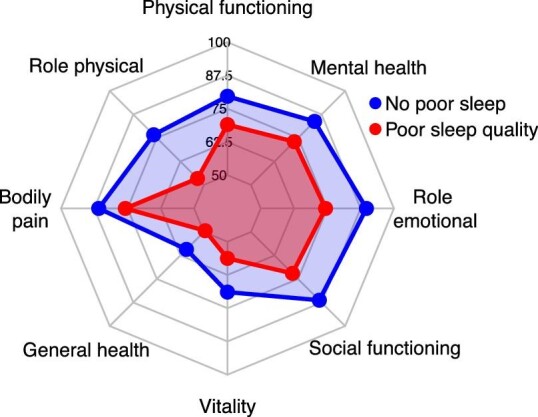
Radar plot of subdomains of HRQoL of KTR. Recipients with poor sleep quality (PSQI score >5, red) had lower scores on all subdomains of HRQoL compared with recipients with no poor sleep quality (blue, P < .001 for all).

Radar plot of subdomains of HRQoL of KTR. Recipients with poor sleep quality (PSQI score >5, red) had lower scores on all subdomains of HRQoL compared with recipients with no poor sleep quality (blue, P < .001 for all).