Figure 1.
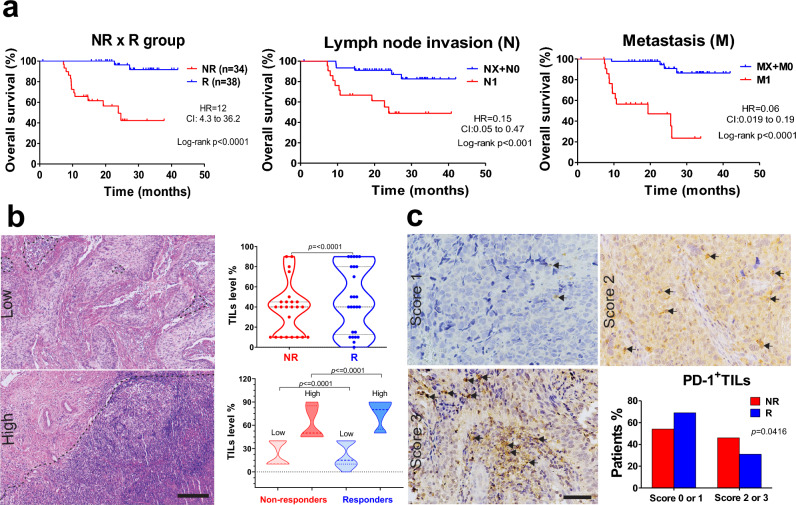
CC patients that respond to chemoradiotherapy exhibit a high survival percentage, high immune cell infiltration, and lower PD-1 score than non-responder patients. (a) Kaplan–Meier survival curves highlight the higher percentage of overall survival in R than NR patients (NR, n = 34 and R, n = 38). Patients with lymph node invasion (N1; NR, n = 48 and R, n = 24) and metastasis (M1, NR, n = 49 and R, n = 23) displayed lower survival. (b) Representative images of low and high stromal TILs stained by H&E. Black outlining separates the TILs area considered. Scale bar = 200 μm. Morphometric analysis in H&E-stained slides illustrated by violin plot showed a higher TILs percentage in the R than NR group (Wilcoxon Signed Rank Test, p = ≤ 0.0001; NR, n = 24 and R, n = 25) and when segregated by low and high stromal TILs (Mann–Whitney test, p = ≤ 0.0001; NR low, n = 15; NR high, n = 9; R low, n = 13 and R high, n = 12). (c) Images of PD-1+ stromal TILs IHC-stained (arrows) in low (1), medium (2), and high (3) scores. Scale bar = 50 μm. The bar graph represents the percentages of NR and R patients when comparing the scores of 0 or 1 and 2 or 3 (Fischer’s exact test, RR = 0.7349; OR = 0.52, 95% CI 0.2958–0.9404, p = 0.0416; NR, n = 24 and R, n = 26). CC, Cervical Cancer; NR, non-responder (Red) patients; R, responder (Blue) patients; TILs, Tumor-infiltrating lymphocytes; H&E, Hematoxylin & Eosin; HR, Hazard Ratio; RR, Relative risk; OD, Odds ratio; CI, Confidence interval; N, Local lymph node invasion at diagnosis (NX, not evaluated; N0, absent; N1, present); M, Distant metastasis at diagnosis (MX, not evaluated; M0, absent; M1, present).

