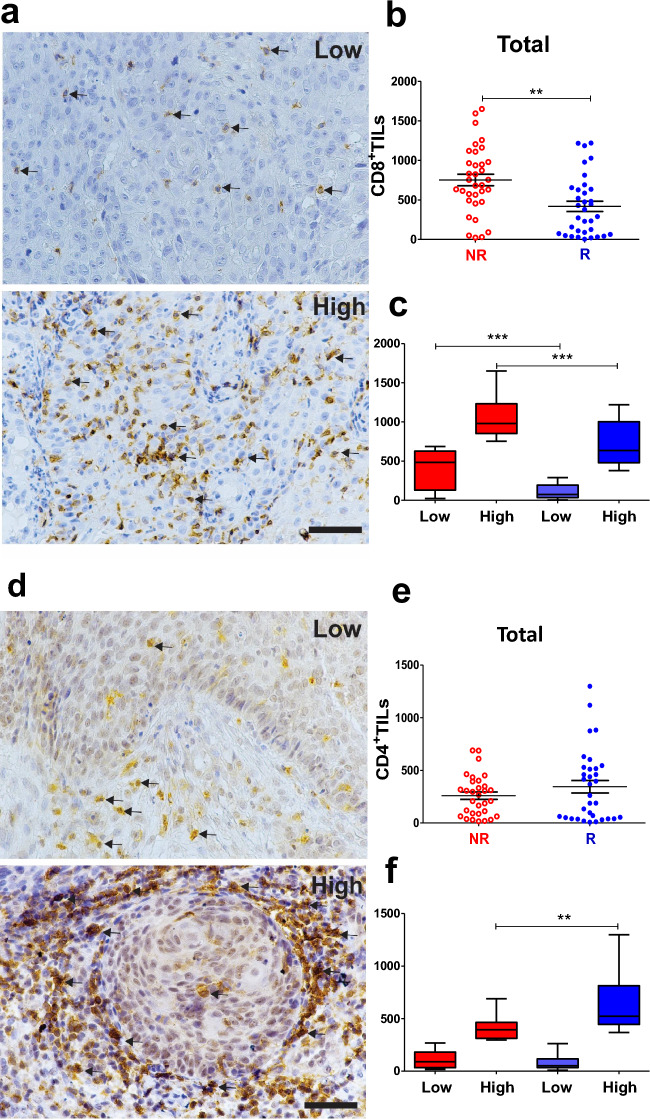
Figure 2.
Non-responder CC patients exhibited elevated numbers of CD8+ TILs. Representative IHC images (a and d) of brown stained immune cells (+) indicating the expression of CD8+ (a) and CD4+ (d) TILs in human CC taken before treatment began at the time of diagnosis. The arrows indicate lymphocytes at high magnification (400x). Scale bar = 50 μm. (b and e) Morphometric analysis showed NR with a higher number of CD8+ TILs than in R patients (b, NR, n = 33 and R, n = 34) and no difference in the number of CD4+ TILs (e, NR, n = 32 and R, n = 33). (c) Number of CD8+ TILs plotted in low and high cell densities showed a higher number of TILs in NR than R group (low NR vs. R and high NR vs. R; NR low, n = 16; NR high, n = 17; R low, n = 17 and R high, n = 17). (f) Higher number of CD4+ TILs in the total sum of R (high R vs. NR; NR low, n = 16; NR high, n = 16; R low, n = 17 and R high, n = 16). Statistical differences are indicated by asterisks (*) p ≤ 0.05, (**) p ≤ 0.01, and (***) p ≤ 0.001. The p values were calculated using the Mann–Whitney test. The graphs show the median and standard error. CC, Cervical Cancer; NR, non-responder (Red) patients; R, responder (Blue) patients.

