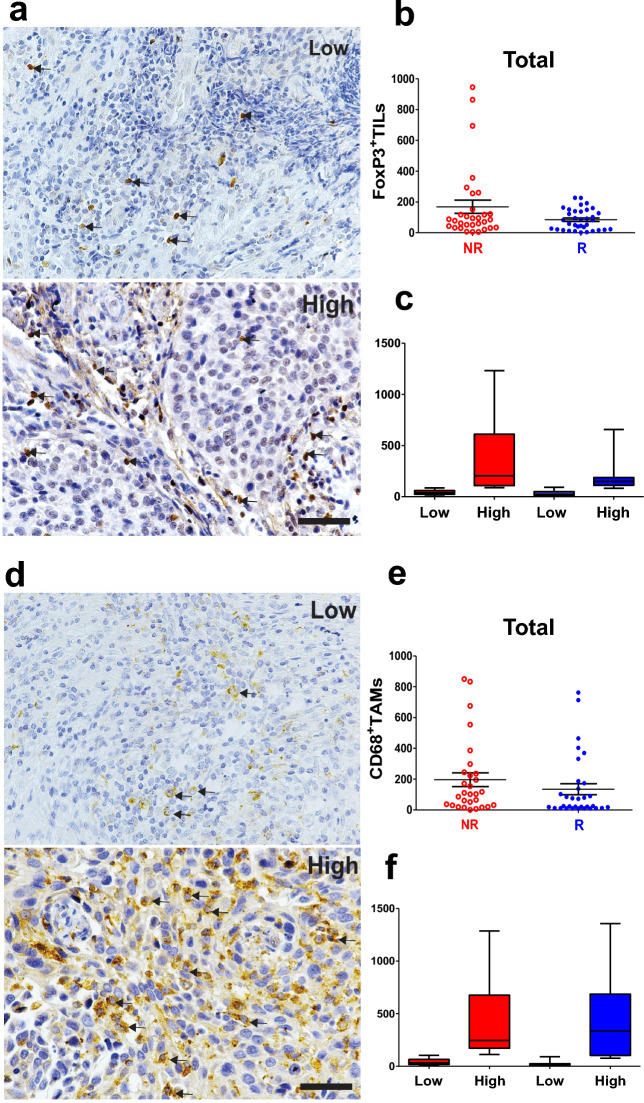
Figure 3.
Total FoxP3+ TILs and CD68+ TAMs expression in CC patients. Representative IHC images of low and high FoxP3+ TILs (a) and CD68+ TAMs (d) are indicated by arrows. Scale bar = 50 μm. Morphometric analysis did not show differences in total FoxP3+ TILs quantification between the groups (b, NR, n = 32 and R, n = 36) and (c, NR low, n = 16; NR high, n = 16; R low, n = 19 and R high, n = 17). (e) No difference was observed in the number of total CD68+ TAMs between the groups (NR, n = 30 and R, n = 34) and (f, NR low, n = 15; NR high, n = 15; R low, n = 19 and R high, n = 15), considering p ≤ 0.05. The p values were calculated using the Mann–Whitney test. The graphs show the median and standard error. CC, cervical cancer; NR, non-responder (Red) patients; R, responder (Blue) patients.

