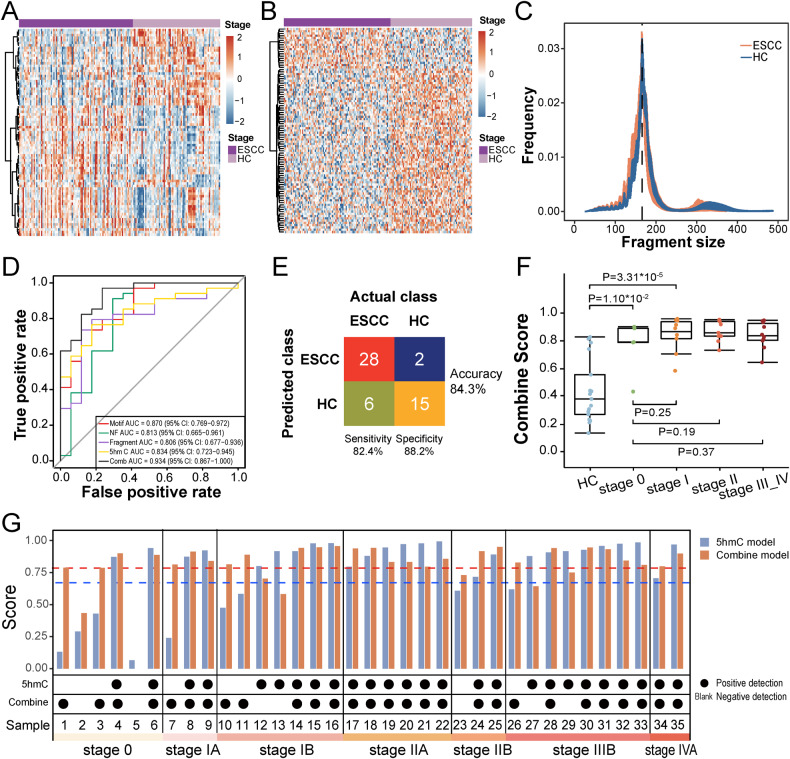
Fig. 4. Development, validation and performance of the integrated diagnostic model.
A Heatmap analysis of differential motifs (p value < 0.001) between ESCC and HC samples. B Heatmap analysis of genes with differential reads coverage between gene promoter and background regions (p values < 0.001) in ESCC and HC samples. C Frequencies comparison of different fragment sizes between ESCC and HC samples. D ROC curves and associated AUC values in the test set. E Confusion matrices of integrated diagnostic model comparing the actual class with the predicted class for ESCC (n = 34) and HC (n = 17) samples in the test set. F Predictive probability scores based on integrated diagnostic model for different clinical stages of the test set samples. G Comparison of diagnostic performance between 5hmC model (blue) and integrated model (red) on different clinical stages of the test set ESCC samples (n = 35). The blue and red dotted line represent the thresholds of diagnostic positive of the 5hmC model and the integrated model, respectively. Positive ESCC detection is indicated by black dots, negative ESCC detection indicated by blank. HC healthy controls, ESCC esophageal squamous cell carcinoma, ROC receiver operating characteristic, AUC area under curve, 5hmC 5-hydroxymethylcytosines.

