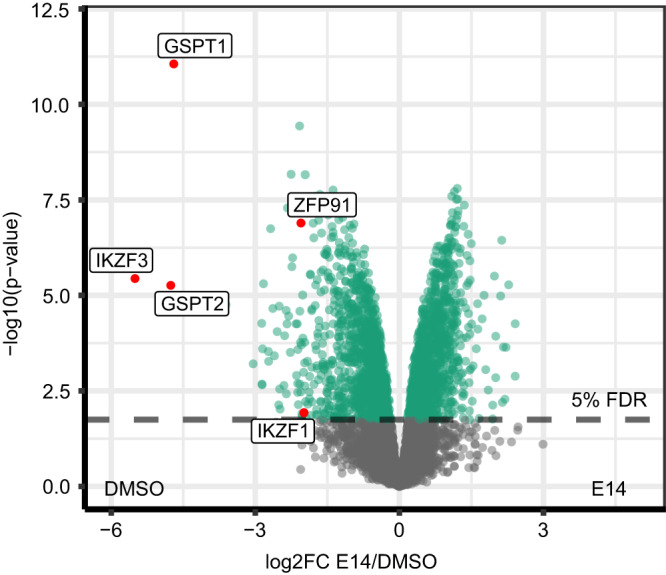
Fig. 9. Quantitative proteomics analysis of compound E14.

Quantitative proteomics in MM.1S cells after 18 h of treatment with compound E14 at 1.0 μM concentration. The control (DMSO) and E14-treated MM.1S were compared using the moderated 2-sample sided 2-sample t-test (n = 4). For each protein the log10 p-value (y-axis) is plotted against the log2FC E14/DMSO. P-values were adjusted using the Benjamini-Hochberg procedure. The significance cut off (5% FDR) is indicated by color. Source data are provided as a Source Data file.
