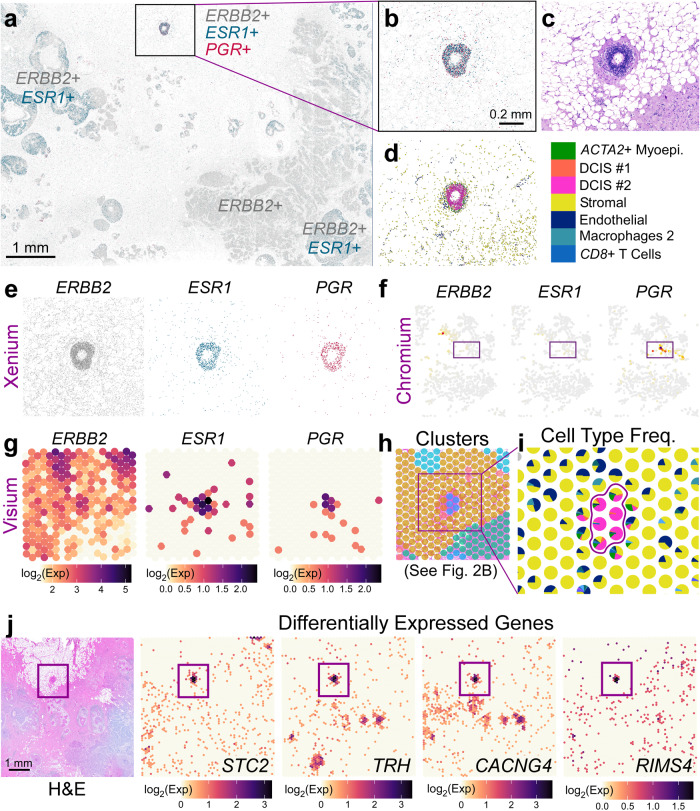
Fig. 5. Visium and Xenium integration derive differentially expressed genes in a triple-positive receptor ROI.
a Xenium spatial plot for ERBB2 (HER2—gray), ESR1 (estrogen receptor—green), and PGR (progesterone receptor—magenta) decoded transcripts. Scale bar = 1 mm. b Closer view of triple-positive ROI. Scale bar = 0.2 mm. c Corresponding H&E image. d Cell types contained within ROI reveal that this is a DCIS #2 tumor epithelium. e Individual Xenium spatial plots from (b). f Chromium scFFPE-seq yields only about 30 cells that are positive for PGR, but these cells do not express ERBB2 or ESR1. g Triple-positive region is identified in Visium (given a priori knowledge from Xenium) and is h part of a distinct cluster (see Fig. 2b). i Spot interpolation (see Supp. Fig. 10) provides cell type frequencies within each Visium spot. Color code legend is shown in (d). j Visium H&E and four representative differentially expressed genes in the tumor epithelium (94 genes; log2FC > 1.5; p-value < 0.05) revealed by Visium data across the whole transcriptome. Scale bar = 1 mm. Differential expression was performed in Loupe Browser (see “Methods”), which performs a variant of the negative binomial exact test (for small gene counts), or a fast asymptotic beta test derived from edgeR (for large gene counts). P-values were adjusted for multiple testing using the Benjamini–Hochberg procedure to control for the false discovery rate. Both the Xenium and Visium experiments were performed in replicate on two serial sections, with one representative section from each technology shown here.

