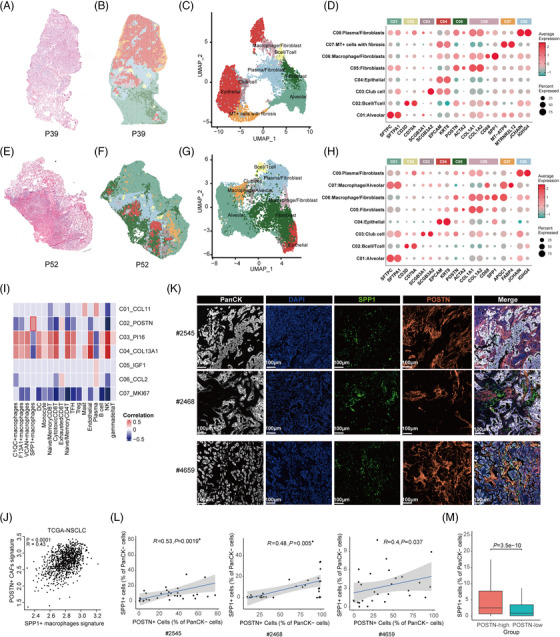
FIGURE 3.

Stereo‐seq reveals spatial proximity of POSTN + cancer‐associated fibroblasts (CAFs) and SPP1 + macrophages in non‐small cell lung cancer (NSCLC). (A–H) Hematoxylin and eosin (H&E) staining of the consecutive slides for Stereo‐seq in P39 (A) and P52 (E). Unbiased clustering of Stereo‐seq bins and UMAP plot for the bin clusters for P39 (B and C) and P52 (F and G). Each colour corresponds to an annotated bin cluster. The expression of signature genes across annotated bin clusters for P39 (D) and P52 (H). The dot size represents the percentage of bins expressing the genes in each bin cluster. (I) Heat map depicting the spearman correlation between CAF sub‐populations and other major cell types using scRNA‐seq data of three cohorts. The correlations with p values greater than .1 were marked as gray. (J) Spearman correlations of the gene signature scores of the POSTN + CAFs (y‐axis) with those of SPP1 + macrophages (x‐axis) using The Cancer Genome Atlas (TCGA)‐NSCLC data. (K) Representative multiplexed immunohistochemistry (mIHC) staining images of tumour cells, POSTN+ CAFs, and SPP1+ macrophages in formalin‐fixed paraffin‐embedded (FFPE) tumour tissues of three NSCLC patients. PanCK (white), DAPI (blue), SPP1 (green), POSTN (orange), in individual and merged channels are shown. Scale bar, 100 μm. (L) Correlation analysis of SPP1+ cells and POSTN+ cells based on mIHC staining in FFPE tumour tissues of three NSCLC patients. (M) Proportions of SPP1+ cells in POSTN‐high and POSTN‐low regions in FFPE tumour tissues of fifteen NSCLC patients. About 30 regions (including POSTN‐high and POSTN‐low regions, 931 × 698 μm per region) were randomly selected from each tumour sample for Spearman correlation analysis and cell proportion calculation. Wilcoxon test was used to assess statistical significance in M. UMAP, Uniform Manifold Approximation and Projection.
