
FIGURE 4.
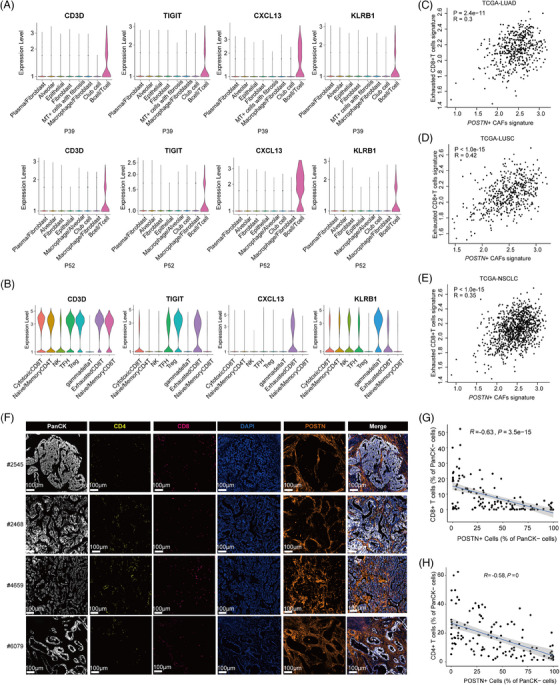
POSTN + cancer‐associated fibroblasts (CAFs) were associated with the exhausted phenotype and lower infiltration of T cells. (A) Violin plots showing expression levels of T cell marker genes across spatial bin clusters in P39 and P52. (B) Violin plots showing marker gene expression in T/NK subclusters based on the scRNA‐seq data of Peking cohort. (C–E) Spearman correlations of gene signatures of exhausted CD8+ T cells and POSTN + CAFs in The Cancer Genome Atlas (TCGA)‐LUAD (C), TCGA‐LUSC (D) and TCGA‐non‐small cell lung cancer (NSCLC) (E) samples. (F) Multiplexed immunohistochemistry (mIHC) staining of NSCLC formalin‐fixed paraffin‐embedded (FFPE) samples showing the localization of POSTN + CAFs, T cells and tumour cells. PanCK (white), CD4 (yellow), CD8 (red), DAPI (blue), POSTN (orange), in individual and merged channels are shown. Scale bar, 100 μm. Experiments were performed in tumour samples from four NSCLC patients. (G and H) Spearman correlation analysis of POSTN+ cells and CD8+ T (G) or CD4+ T cells (H) based on tumour regions selected from each sample. LUAD, lung adenocarcinoma; LUSC, lung squamous cell carcinoma.