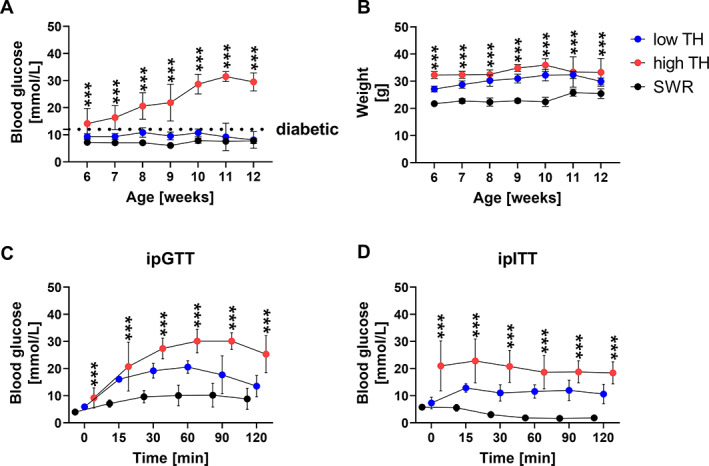
Fig. 1.

Metabolic parameters show differences between diabetic TH (high TH) and nondiabetic (low TH). (A) Nonfasting blood glucose levels and (B) weight were measured for TH and SWR/J male mice once a week starting from 6 weeks of age until 12 weeks of age. (C) ipGTT, the glucose tolerance was assessed by intraperitoneal glucose tolerance test in 12‐week‐old mice. D‐glucose dissolved in PBS was administered 2 g/kg body weight. Fasted blood glucose levels were measured immediately before and 15, 30, 60, 90, and 120 min after glucose administration. (D) Insulin tolerance was investigated by intraperitoneal insulin tolerance test (ipITT) in 12‐week‐old mice. 0.4 IU/kg body weight insulin was administered and fasted blood‐glucose levels were measured immediately before and subsequently at 15, 30, 60, 90, and 120 min after. Data are shown as mean ± SD. n = 5. Statistical analysis was performed by one‐way ANOVA followed by Bonferroni correction. Statistical significance is denoted in the graphs. *p < 0.05, **p < 0.001, ***p < 0.001.
