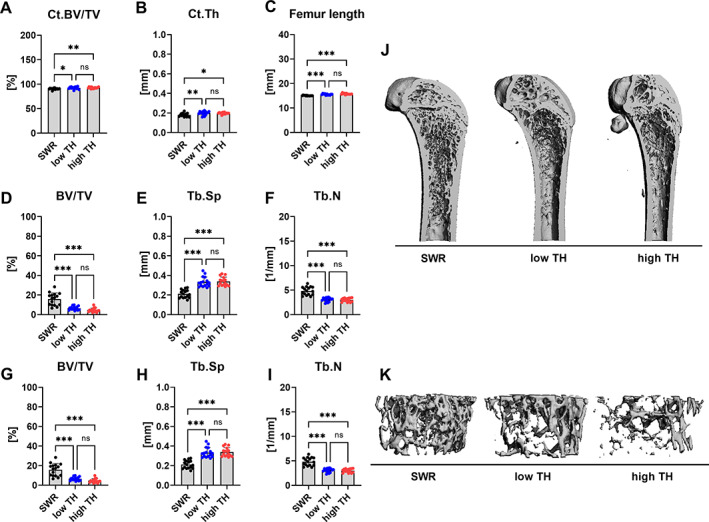
Fig. 2.

Differences in trabecular bone architecture and bone mineral density. Bones from 12‐week‐old male TALLYHO/JngJ either with hyperglycemia and without hyperglycemia and SWR/J were examined by μCT. (A) cortical bone volume/total volume (Ct.BV/TV) and (B) cortical thickness at the femoral midshaft was determined. (C) Femur length was measured with a caliper (D) bone volume per total volume (BV/TV), (E) trabecular separation (Tb.Sp), and (F) trabecular number (Tb.N) were determined in the distal femur. (G) bone volume per total volume (BV/TV), (H) trabecular spacing (Tb.Sp), and (I) trabecular number (Tb.N) were evaluated at L4 vertebrae from all groups. (J) Representative 3D reconstructions of the whole femur. (K) Representative 3D reconstructions of the trabecular compartment of L4 vertebrae from SWR/J and TALLYHO/JngJ with and without hyperglycemia. Data are shown as mean ± SD. n = 16. Statistical analysis was performed by one‐way ANOVA and Bonferroni correction. Statistical significance is denoted in the graphs. *p < 0.05, **p < 0.001, ***p < 0.001.
