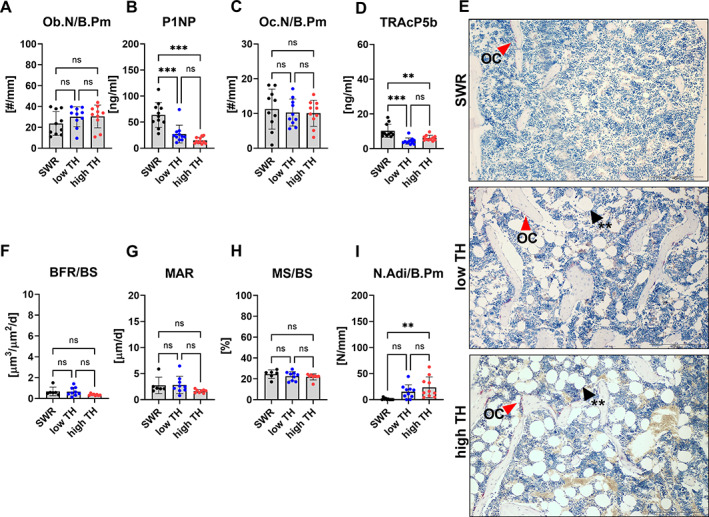
Fig. 4.

Histological and histomorphometric analysis of the femur. Bones and serum samples from 12‐week‐old TALLYHO/JngJ that either are hyperglycemic or normoglycemic and the recommended control SWR/J were used for histological analysis and determination of bone turnover markers. (A) Osteoblast number per bone perimeter (Ob.N/B.Pm) was determined in TRAP‐stained sections of the femur. Serum concentration of (B) bone formation marker type 1 procollagen amino‐terminal‐propeptide (P1NP) was measured by ELISA. (C) osteoclast number per bone perimeter (Oc.N/B/Pm) were determined in TRAP‐stained sections in the femur and (D) tartrate resistant acid phosphatase (TRAcP5b) was measured by ELISA. (E) Representative images of TRAP‐stained femur. Red arrows indicate osteoclast. Black arrows indicate adipocytes. (F) bone formation rate per bone surface (BFR/BS), (G) mineral apposition rate (MAR), (H) mineralized surface per bone surface (MS/BS), and (I) number of adipocytes per bone perimeter (N.Adi/B.Pm) were assessed using histomorphometry and histological analysis of the femur. Data are shown as mean ± SD. n = 11. Statistical analysis was performed by one‐way ANOVA and followed by Bonferroni correction. Statistical significance is denoted in the graphs. *p < 0.05, **p < 0.001, ***p < 0.001.
