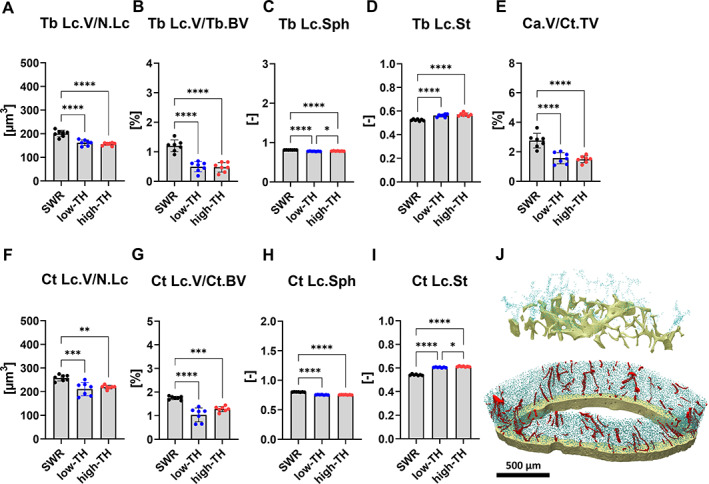
Fig. 7.

Characterization of osteocyte lacunar network. High‐resolution μCT was performed on femurs from 12‐week‐old TALLYHO/JngJ either with T2DM or without and the recommended control SWR/J. (A) Trabecular lacunar volume over number of lacunar (Tb.Lc.V/N.Lc) and (B) Trabecular lacunar volume over bone volume (Tb.Lc.V/Tb.BV). Additionally the morphology of the osteocytes was investigated. (C) Trabecular lacunar sphericity (Tb.Lc.Sph) and (D) trabecular lacunar stretch (Tb.Lc.St). (E) Canal volume density over canal cortical total volume (Ca.V/Ct.TV), (F) cortical lacunar volume over number of lacunar (Ct.Lc.V/N.Lc), (G) cortical lacunar volume over cortical bone volume (Ct.Lc.V/Ct.BV), (H) cortical lacunar sphericity (Ct.Lc.Sph), and (I) cortical lacunar stretch (Ct.Lc.St). (J) Representative 3D reconstructions of trabecular bone and cortical bone. Blue represents osteocytes and red represents pores. Data are shown as mean ± SD. n = 7. Statistical analysis was performed by one‐way ANOVA and Tukey test. Statistical significance is denoted in the graphs. *p < 0.0332, **p < 0.0021, ***p < 0.0002, ****p < 0.0001.
