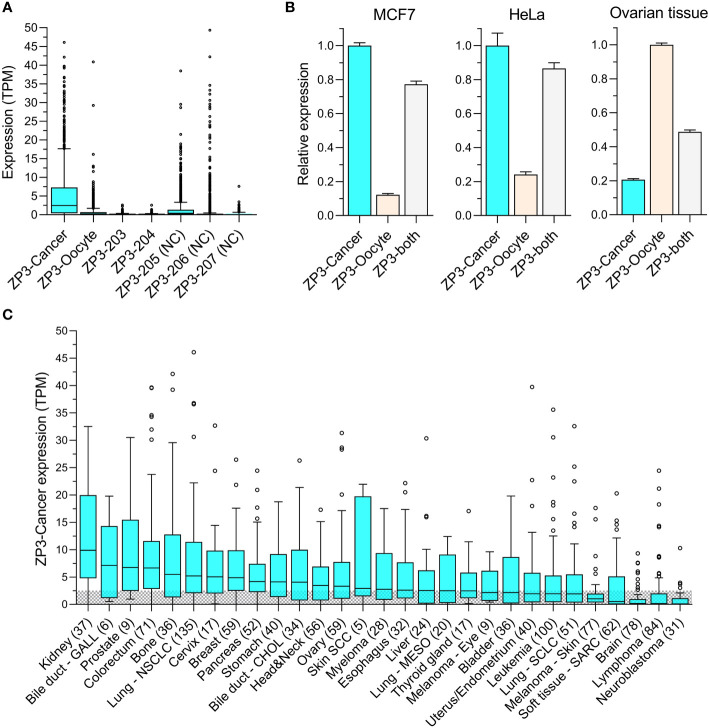
Figure 3.
ZP3-Cancer is the dominant transcript in tumor cells and is differentially distributed among cancer types. (A) Expression of the seven annotated ZP3 transcripts in CCls (n=1339). Bars represent Tukey box plots (boxes are median+IQR). Median transcript expression levels (from left to right) are 2.47, 0.22, 0.0, 0.04, 0.42, 0.0 and 0.0 TPM. ZP3-Cancer expression is significantly higher compared to all other transcripts (Kruskal-Wallis test, p < 0.0001). NC = Non-protein coding. (B) Relative expression of ZP3-cancer and ZP3-Oocyte in the CCLs MCF7 and HeLa, and in healthy ovarian tissue containing follicles, as determined by qPCR. ZP3-Cancer expression is set to 1 for MCF7 and HeLa, ZP3-Oocyte expression is set to 1 for ovarian tissue. ‘ZP3-both’ served as a positive control and used primers designed to detect ZP3-Cancer and ZP3-Oocyte simultaneously. Bars represent mean+SD for the triplicate qPCR reactions. (C) Differential expression of ZP3-Cancer in the cancer types covered by the CCLs. Cancer types represented by less than 5 CCLs were not included. Bars represent Tukey box plots (boxes are median+IQR). Number of samples are indicated between brackets. The shaded area indicates CCLs with a ZP3-Cancer expression level below the overall median (2.54 TPM).

