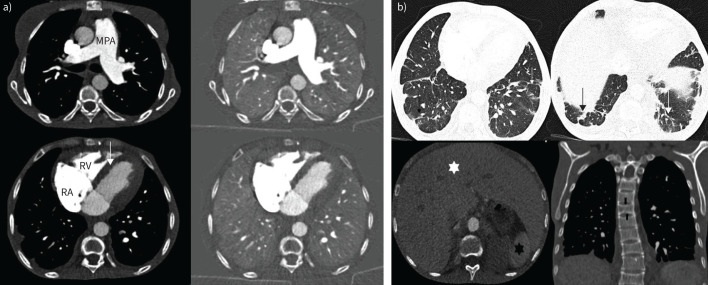
FIGURE 5.
a) Axial images from a dual-energy computed tomography (CT) showing dilated main pulmonary artery (MPA), mildly dilated right atrium (RA), mildly dilated right ventricle (RV) with mild right ventricular hypertrophy and flattening of interventricular septum (arrow). Iodine maps (right panel) demonstrate homogenous perfusion in both lungs. b) Lung windows from the same CT series show bilateral subsegmental atelectatic bands in both lower lobes (top panel, thin arrows). The liver is enlarged and congested (white star) and spleen is atrophic (back star). Coronal views (bottom right) show the characteristic end-plate depression of sickle cell disease (block arrows).

