
FIGURE 5.
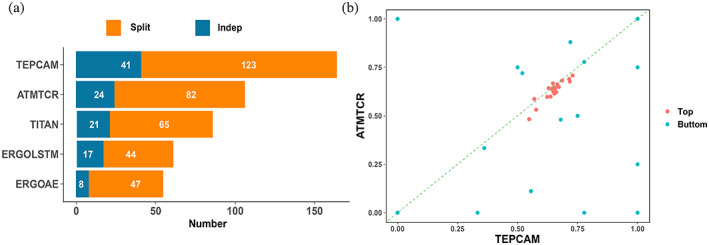
Comparison of area under the receiver operating characteristic curve (AUROC) for each epitope. (A) Number of top‐ranked epitopes predicted by the models. (B) Comparison of AUROC between TEPCAM and ATM‐TCR for the top 20 and bottom 20 epitopes based on their count numbers.