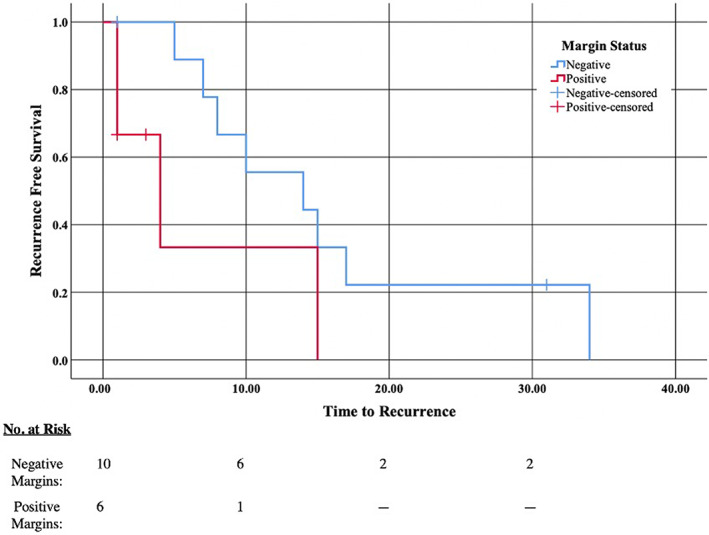
FIGURE 2.

Kaplan–Meier analysis of time to recurrence (in months) and negative pathologic margins. There was a decreased recurrence associated with negative margins (X 2 = 2.952, p = .086). Negative for negative final pathologic margins, Positive for positive final pathologic margins, Negative‐censored for negative final pathologic margins though patient was lost to follow‐up at this timepoint, and Positive‐censored for positive final pathologic margins though patient was lost to follow‐up at this timepoint.
