
Figure 4.
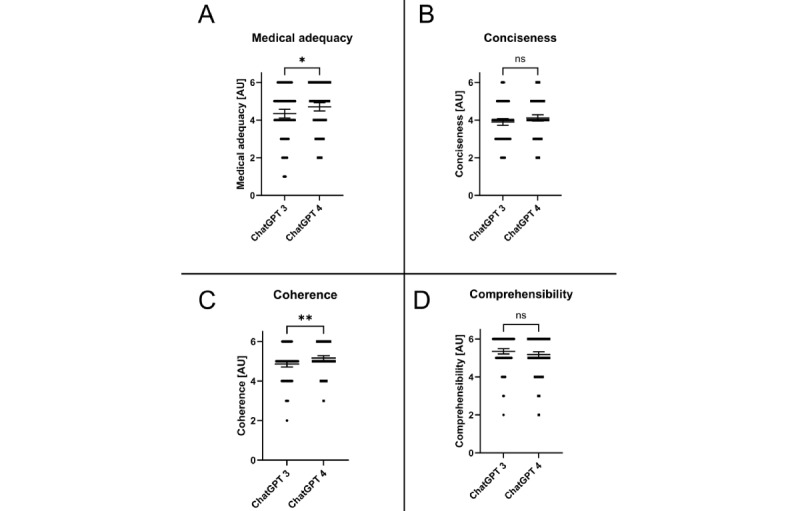
Comparison between LLMs (ChatGPT 3 vs ChatGPT4) for all evaluated categories. Data shown as a scatter dot blot with each point resembling an absolute value (bar width resembling a high amount of individual values). Horizontal lines represent mean (95% CI). The nonparametric Mann-Whitney U test was used to compare the 2 groups. Cumulative results of ratings for (A) medical adequacy, (B) conciseness, (C) coherence, and (D) comprehensibility. ns: not significantly different. *P<.05; **P<.01.