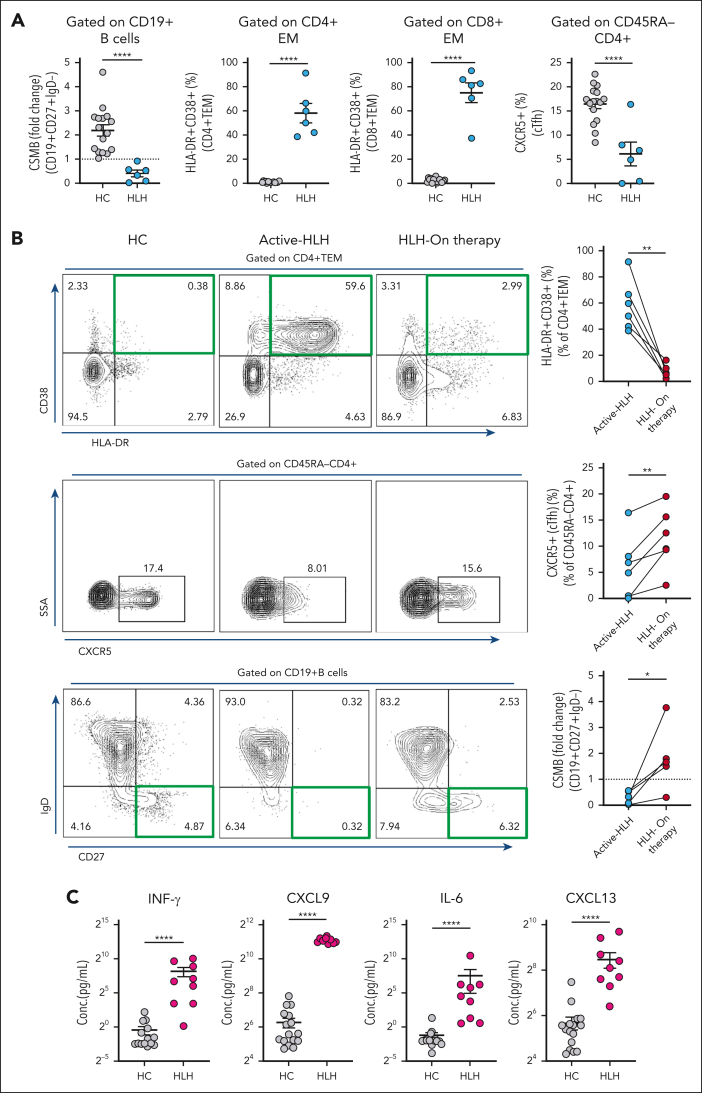
Figure 4.
B-cell activation and class switching are impaired in active HLH. (A) Age-normalized values of CSMB (CD19+CD27+IgD−) (2.19 ± 0.24 vs 0.41 ± 0.14) represented as fold change and percentages of CD4+ effector memory T cells (CD4+TEM, CD4+HLA-DR+CD38+; 0.94% ± 0.14% vs 58.02% ± 7.93%), CD8+TEM cells (CD8+HLA-DR+CD38+; 2.42% ± 0.43% vs 75.12% ± 8.10%), and cTFh (CD45RA−CD4+CXCR5+; 16.47% ± 0.96% vs 6.10% ± 2.45%) were determined in the peripheral blood of HCs (n = 16) vs patients with HLH (P-HLH, n = 5; I-HLH, n = 1; total, n = 6). (B) Percentage of activated CD4+ TEM cells (n = 6) decreased when patients with HLH received therapy (top), whereas percentages of CXCR5+ cTfh cells (n = 6) (middle) and age-normalized fold change values of CSMB cells (n = 5) (bottom) in patients with HLH increased while on therapy. Representative flow cytometry dot plots from HCs and patients with HLH are shown adjacently (left), with a green or black rectangle highlighting the population of interest. (C) Cytokine profiling of IFN-γ (0.74 ± 0.30 pg/mL vs 296.1 ± 130.3 pg/mL), CXCL9 (76.90 ± 14.69 pg/mL vs 2163.0 ± 82.19 pg/mL), IL-6 (0.42 ± 0.14 pg/mL vs 187.2 ± 156.5 pg/mL), and CXCL13 (51.04 ± 9.78 pg/mL vs 355.0 ± 84.02 pg/mL) in HCs (n = 16) vs patients with HLH (P-HLH, n = 3; I-HLH, n = 6; Total, n = 9). The two-tailed Student t test or the Mann-Whitney test was used, depending on the normality for statistical comparison between 2 groups. Data represent mean ± SEM; ∗P < .05; ∗∗P < .01; ∗∗∗P < .001; ∗∗∗∗P < .0001.

