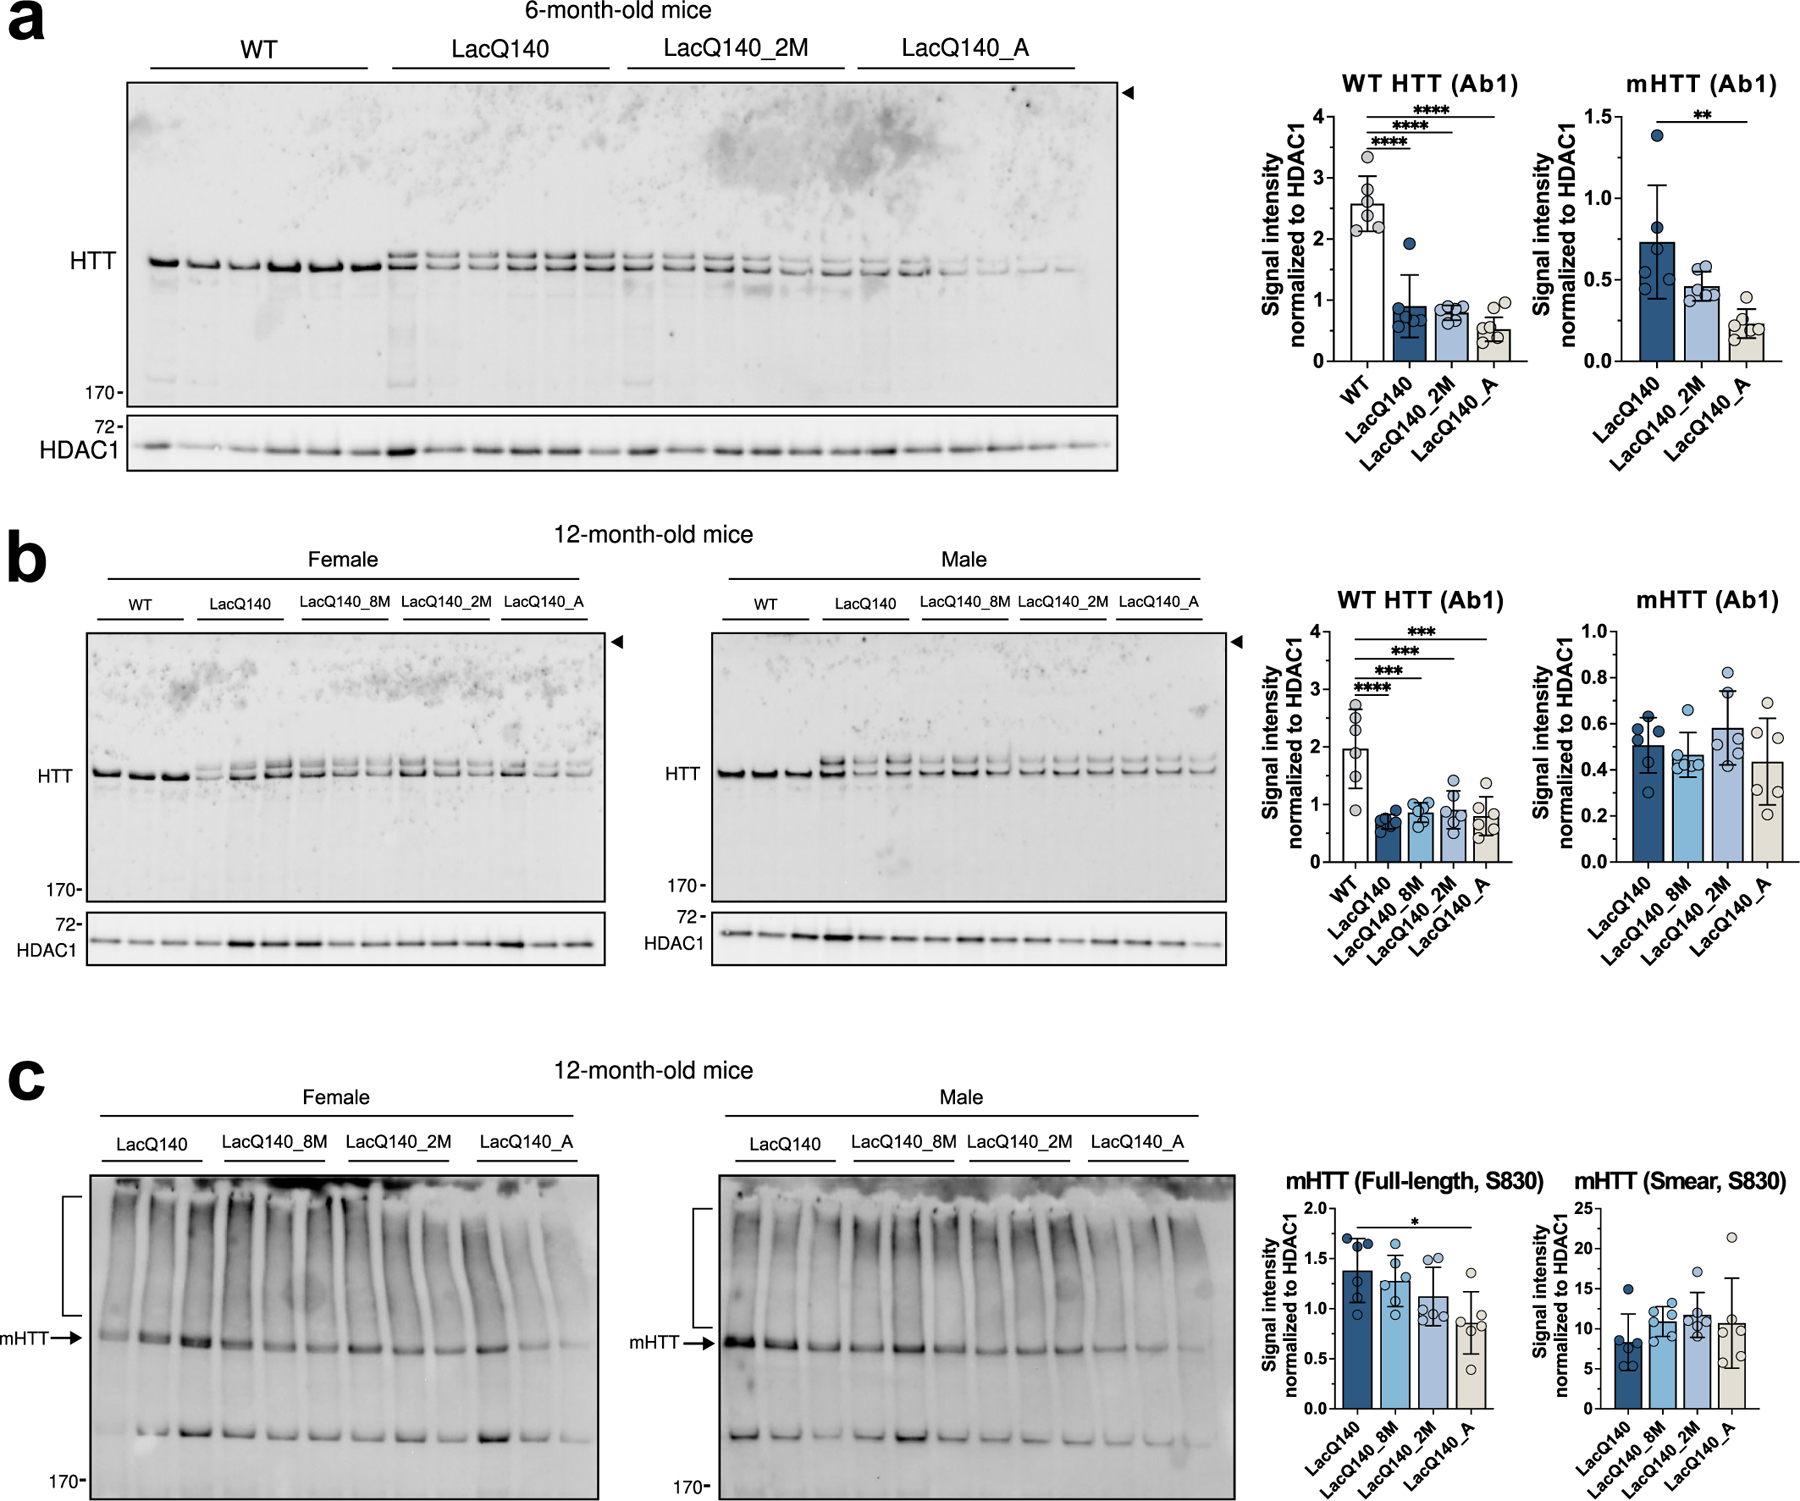
Fig. 3.

HTT protein levels in P1 fractions.
Equal protein (10 μg) from P1 fractions from 6-month-old (a) and 12-month-old (b) LacQ140 and WT mice were analyzed by western blot for HTT levels with anti-HTT Ab1. No aggregated protein was observed at the top of the gel (arrowhead). Total pixel intensity quantification for each band was measured using ImageJ software and normalized to HDAC1 signal. There was a significant decrease in WT HTT signal in all the treatment conditions for LacQ140 mice compared to WT mice in both (a) 6-month-old mice (F(3, 20) = 40.34, ****P<0.0001, One-way ANOVA with Tukey’s multiple comparison test, n=6) and (b) 12-month-old mice (F(4, 25) = 11.01, ****P<0.0001, One-way ANOVA with Tukey’s multiple comparison test, n=6). There were significantly lower levels of mHTT in the 6-month-old LacQ140_A mice compared to LacQ140 (a, F(2, 15) = 8.233, **P=0.0039, One-way ANOVA with Tukey’s multiple comparison test, n=6) but no changes in mHTT levels were detected in the 12-month-old LacQ140 mice (F(3, 20) = 1.137, P=0.3583, n.s., One-way ANOVA), (b). Equal protein (10 μg) from P1 fractions from 12-month-old LacQ140 and WT mice were analyzed by western blot for HTT levels with anti-HTT S830 (c). The S830 antibody detected a smear of HTT signal (bracket) as well as full-length mHTT (arrow). There were significantly lower levels of full length mHTT in the 12-month-old LacQ140_A mice compared to LacQ140 (F(3, 20) = 3.548, *P=0.0330, One-way ANOVA with Tukey’s multiple comparison test, n=6) and no changes detected in the HTT smear in all LacQ140 mice (F(3, 20) = 0.9281, P=0.4453, n.s., One-way ANOVA). Asterisks on graphs represent Tukey’s multiple comparison test, n=6 mice per group (*p<0.05, **p<0.01, ***p<0.001, ****p<0.0001).
