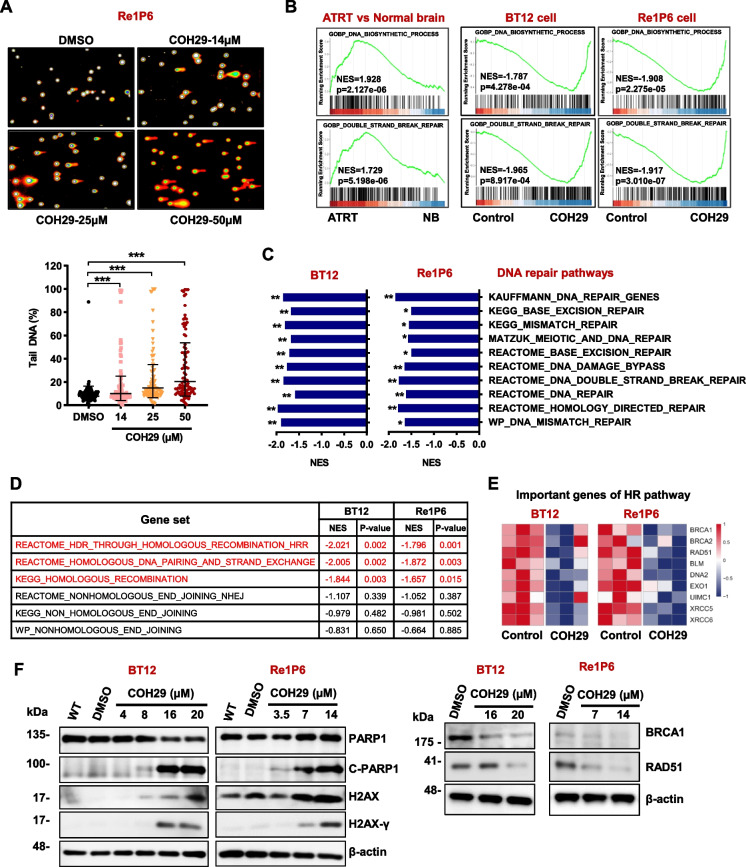
Fig. 6.
COH29 treatment activated DNA damage in ATRT. A Images and corresponding graph of comet assay after incubating Re1P6 cells with COH29. Comet assay data were analyzed using the Comet Score software. The pink and blue circles represent the DNA in the nucleus, while the orange represents the fragmented DNA. Representative of tail DNA (%) used DMSO treatment as control. Data are presented as the Geometric means with geometric SD of three independent experiments. ** p ≤ 0.01, *** p ≤ 0.001, Student’s t-test. B Gene set enrichment analysis of the DNA_biosynthetic_process and Double_strand_break_repair process in ATRT samples and BT12, Re1P6 cells after being treated with COH29. C, D GSEA analysis of the C2 Curated dataset indicated DNA repair pathways (C), or HR, NHEJ pathways (D) in COH29-treated cells in comparison with the controls. NES normalized enrichment score, p. adjusts value *p < 0.05, **p < 0.01. E Heatmap represents the expression of genes that play an important role in the HR pathway in BT12 and Re1P6 treated cells versus control. F Immunoblotting for DNA damage and HR markers of BT12 and Re1P6 cells treated with COH29 in 72 h and 48 h, respectively

