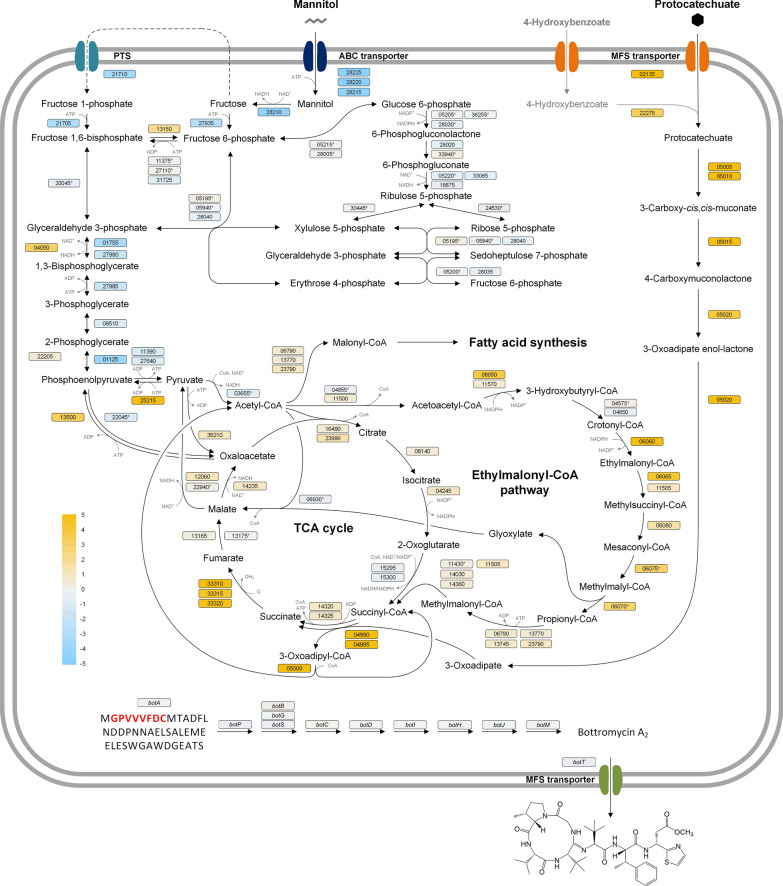
Fig. 5.
Transcriptome profiling of bottromycin-producing S. lividans ΔYA8-DG2 during growth on mannitol and protocatechuate (10 mM). The data display differences in the expression of genes encoding central carbon pathways between mannitol- and protocatechuate-cultured cells after 12 h. The differences are highlighted by colour (blue, downregulated on protocatechuate; yellow, upregulated on protocatechuate). The metabolic network was assembled from the KEGG database, including the following manual curation. The genes encoding the mannitol uptake system were identified in this work (Table 4). Structurally, the uptake system matches that from C. glutamicum [16, 103]. The cofactor specificity of phosphoenolpyruvate carboxykinase (PEPCk) and pyruvate carboxylase (PC) was inferred from the corresponding enzymes of S. coelicolor M145 [104]. The cofactor specificity of succinate dehydrogenase was taken from E. coli [105]. All other cofactors refer to S. lividans TK24 [63]. The genes of the ethylmalonyl-CoA pathway were inferred from BLAST analysis (Additional file 1: Table S1). The core peptide of bottromycin is marked in red. + Putative genes, *Genes not significant (Benjamini‒Hochberg FDR > 0.05) but included for completeness. The data represent mean values and standard deviations from three biological replicates (n = 3)

