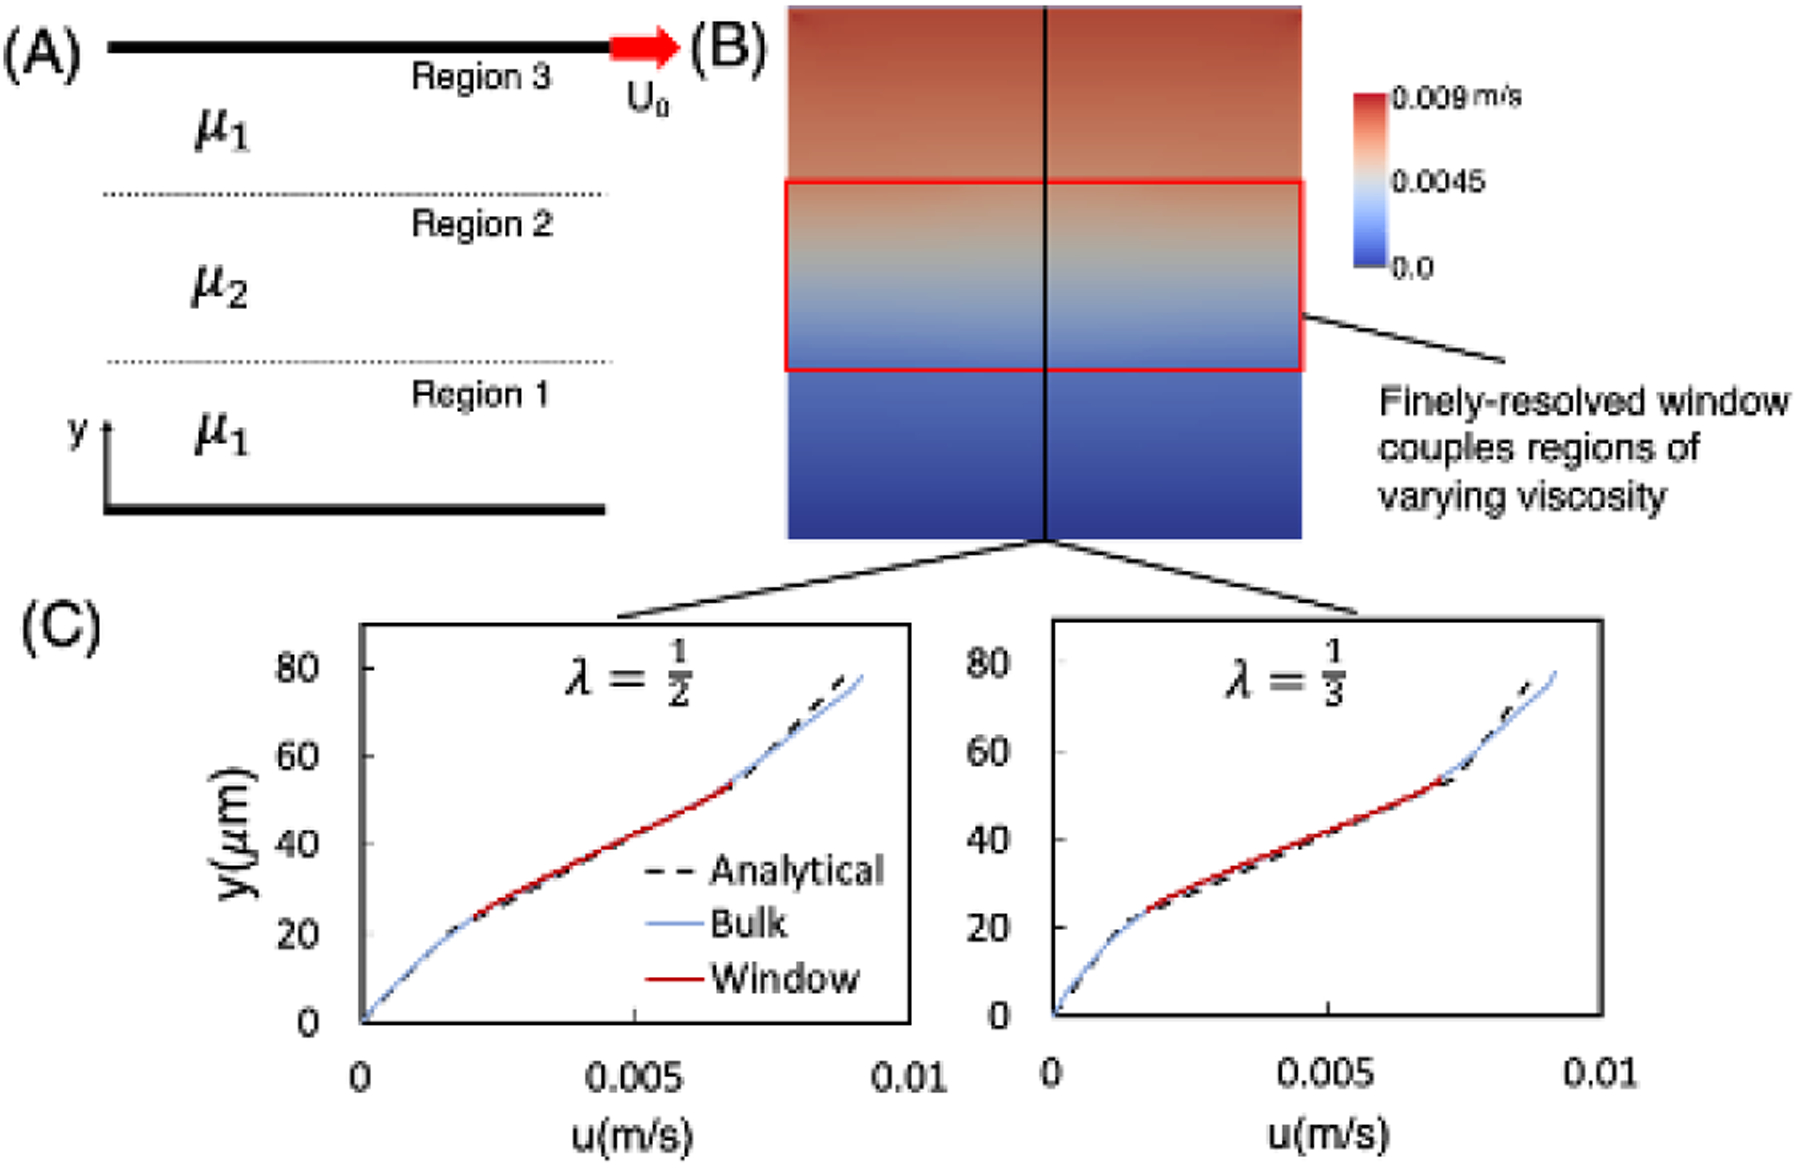
Figure 4:

Verification of the variable viscosity capability of our method. (A) Simulation schematic depicting the variable viscosity shear flow configuration, with the bottom stationary plane, the top plane moving with velocity in the direction shown, and three regions as labeled. (B) Contours give the fluid velocity corresponding to a representative profile. Regions 1 and 3 have the same viscosity which is greater than that of Region 2 , and the viscosity contrast is . A finely resolved window (red) is placed the center of the domain with top/bottom boundaries aligned with the region boundaries as shown. (C) Velocity profiles as a function of position and passing through the window. Results are shown for and . The dashed black line gives the solution per Eq. 8, the solid blue line gives the velocity profile through the bulk domain, and the solid red line gives the profile through the window domain.
