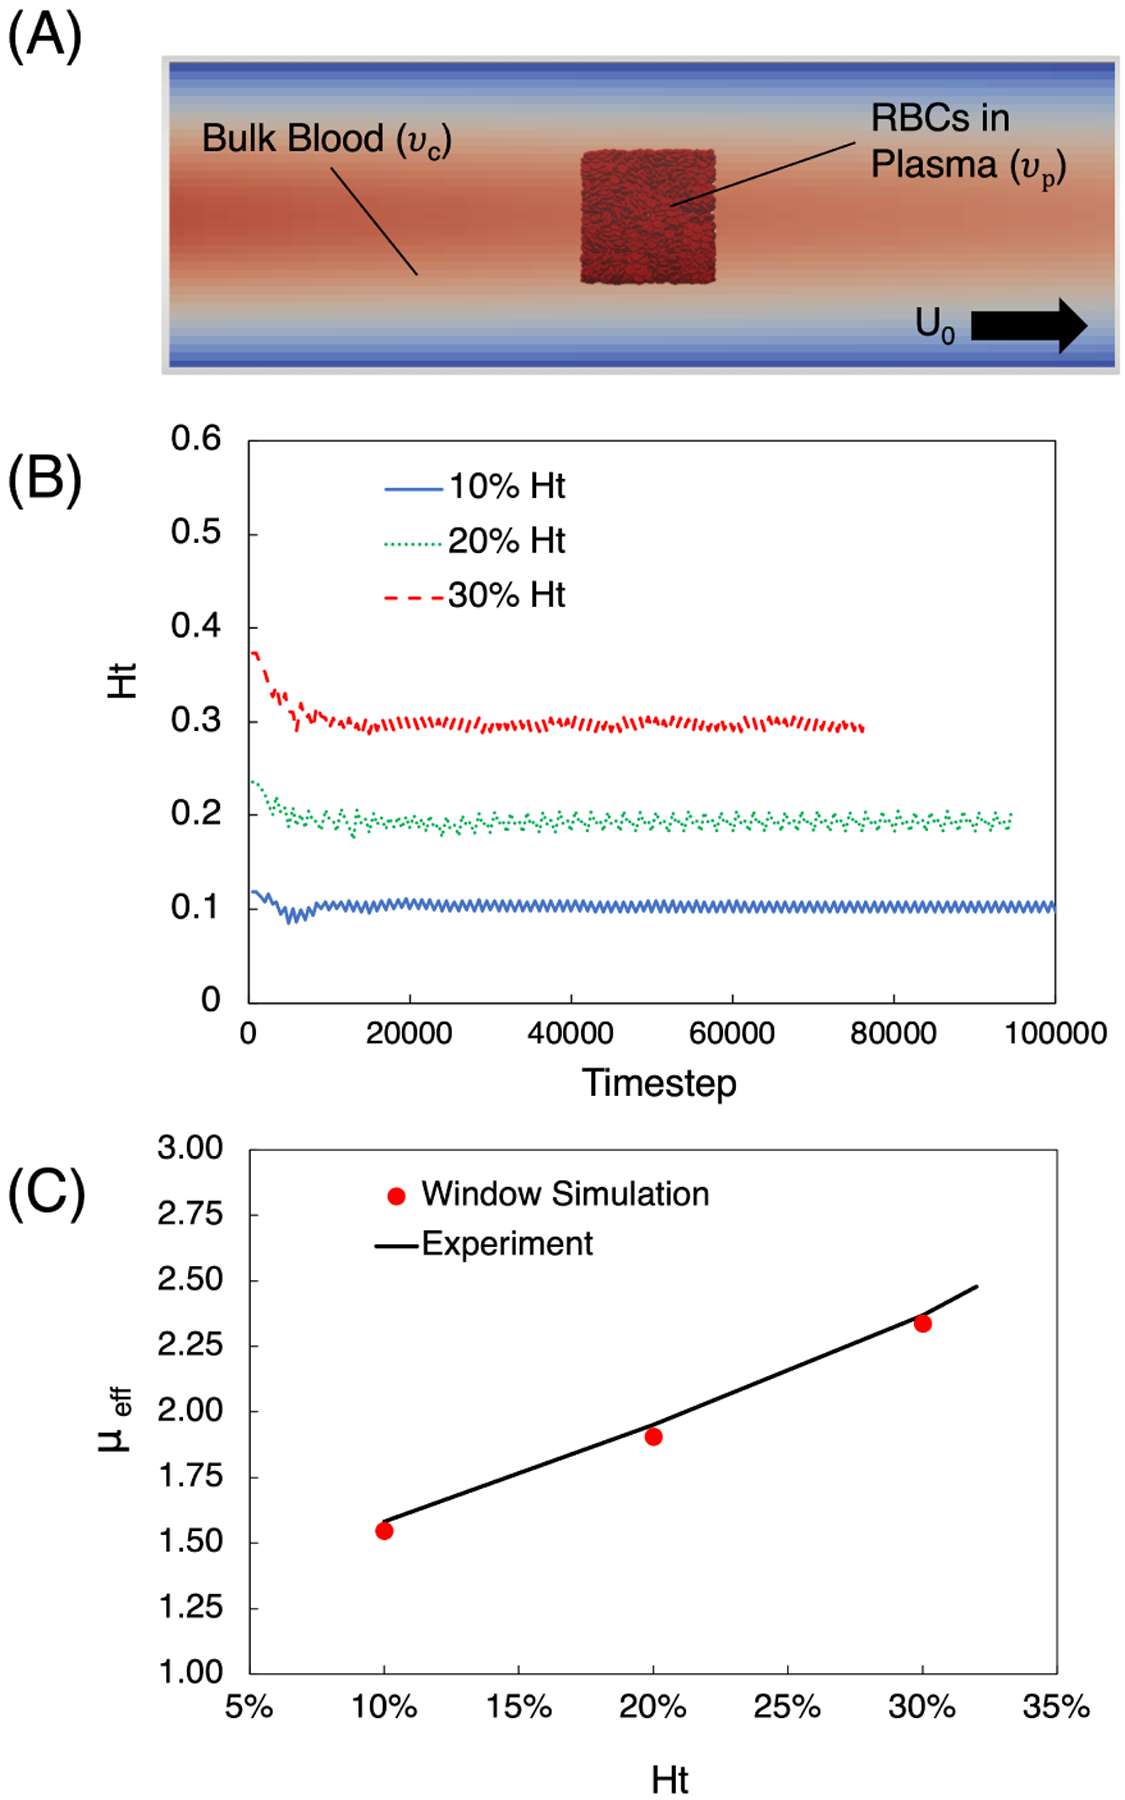
Figure 5:

Cell resolved window simulation and comparison with experiment. (A) Schematic depicting the simulation setup, with the cell-resolved window placed a the center of a tube of diameter . Outside the window the fluid represents bulk blood flowing in the direction of the black arrow. (B) Hematocrit versus time for the 10% – 30% cases, demonstrating the ability of the method to maintain the desired value. (C) Effective viscosity predicted by the window simulation as a function of hematocrit, compared against the experimental correlation[21] given by Eq. 9.
