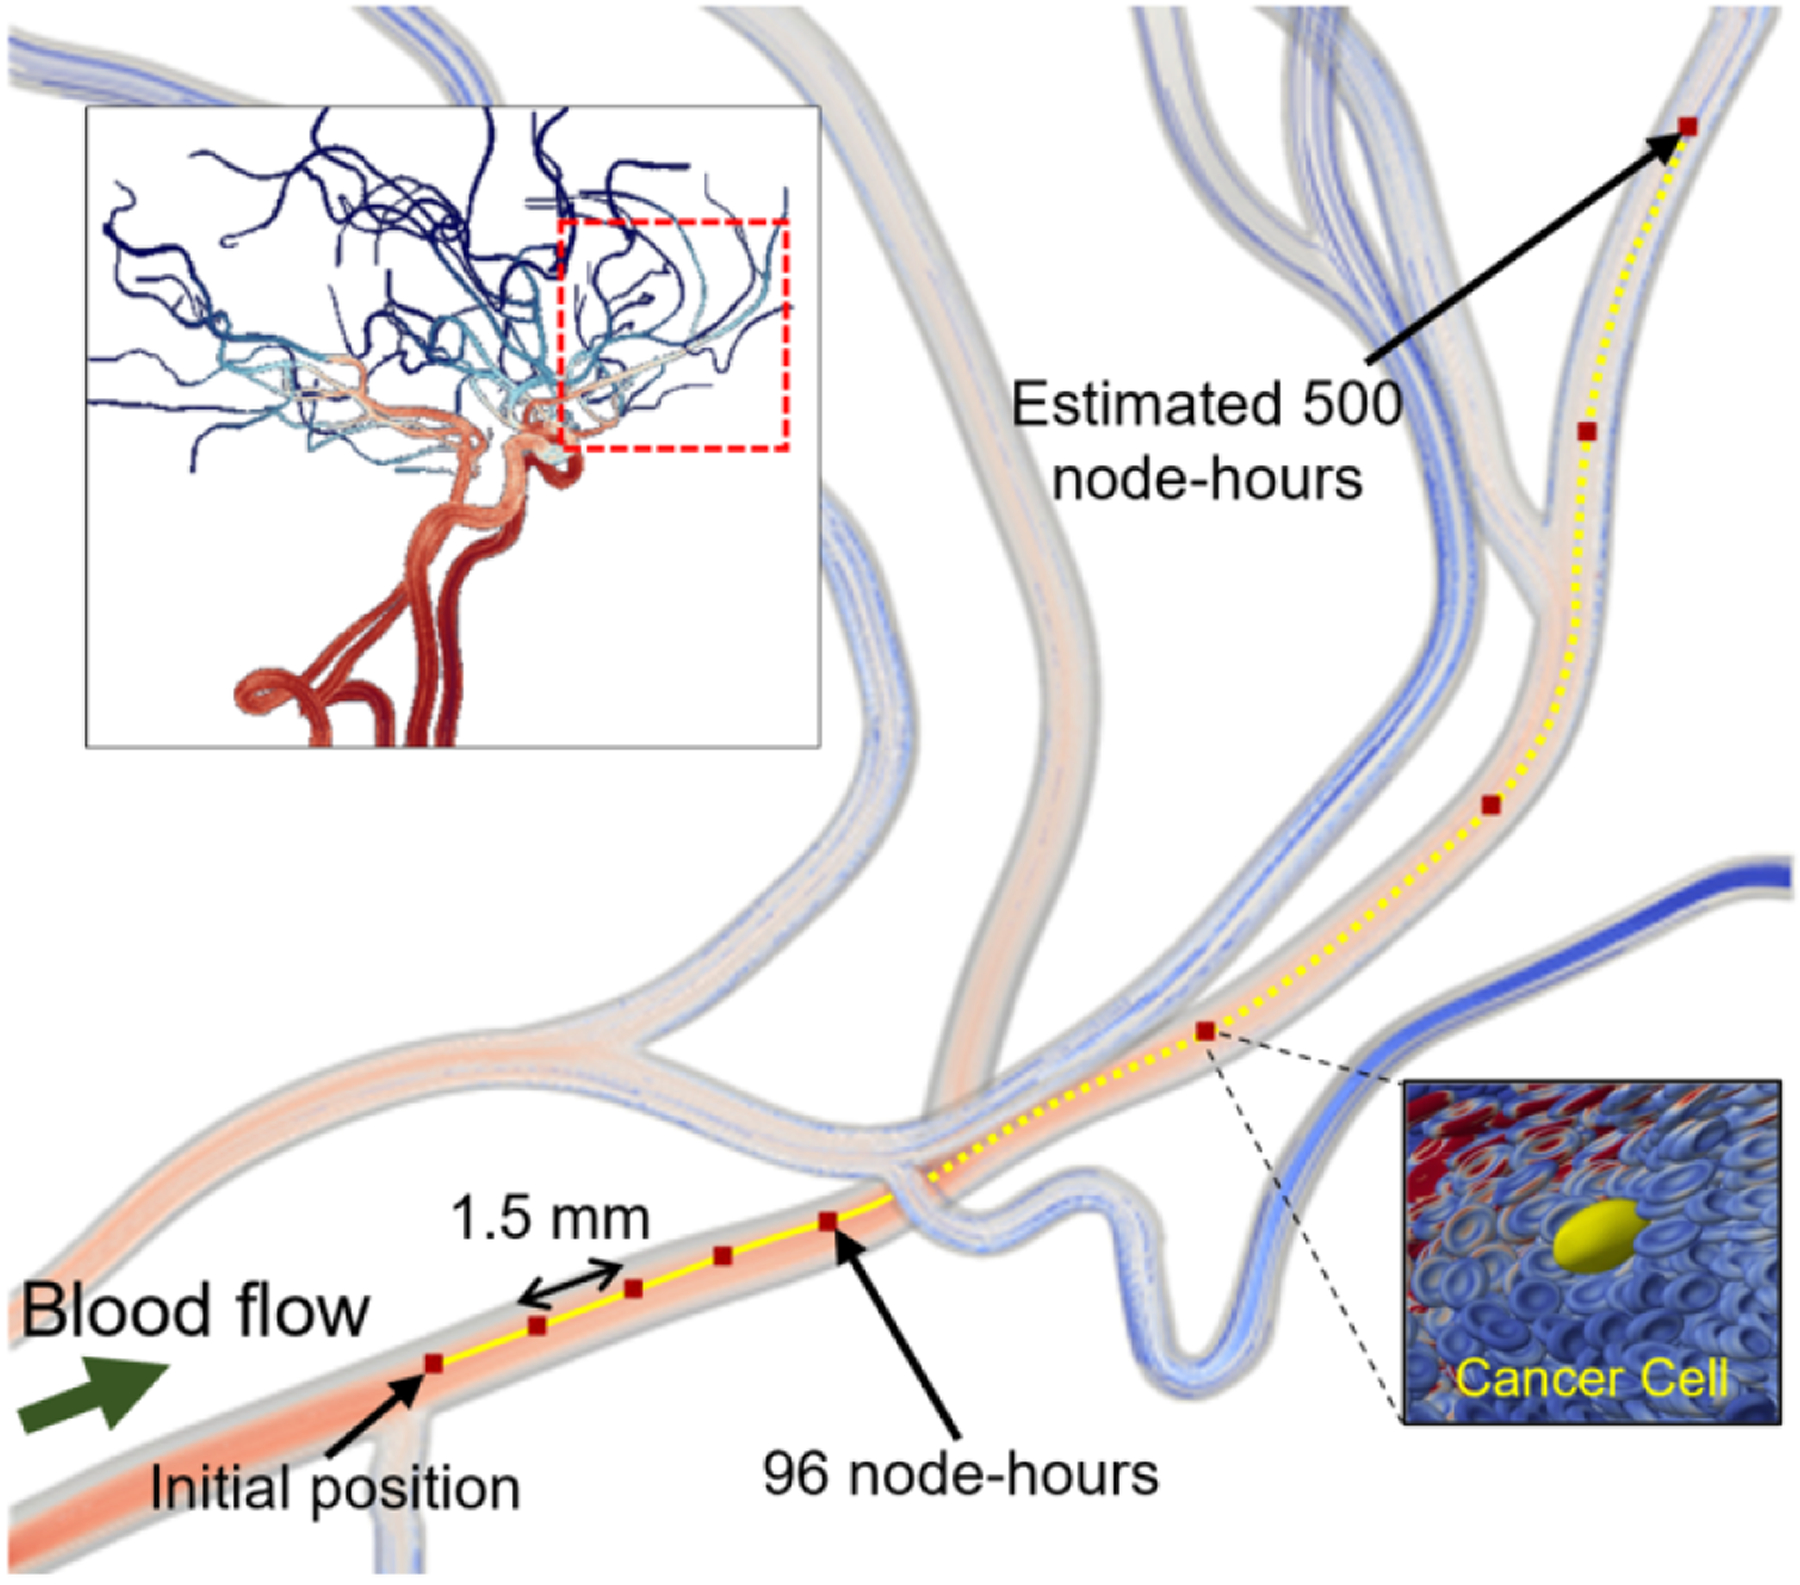
Figure 9:

The APR method makes submicron fidelity simulations of CTC trajectory over mm-length scales tractable. We perform an APR simulation of cancer cell transport through a cerebral vasculature on AWS, using one node of VMs with eight NVIDIA Tesla V100 GPUs and 48 Intel Xeon Platinum 8175M CPUs. The upper-left panel provides streamlines through a patient-derived cerebral vasculature. The main panel provides a zoomed-in view of the window the location encompassed by the red dashed box in the upper-left panel. The solid yellow line traces the cancer cell trajectory as it is transported at a rate of 1.5 mm per simulation day, with the dashed yellow line predicting 500 node-hours to travel the entire length of the zoomed-in vessel. The lower-right panel shows the deformed CTC in yellow and its surrounding RBCs.
