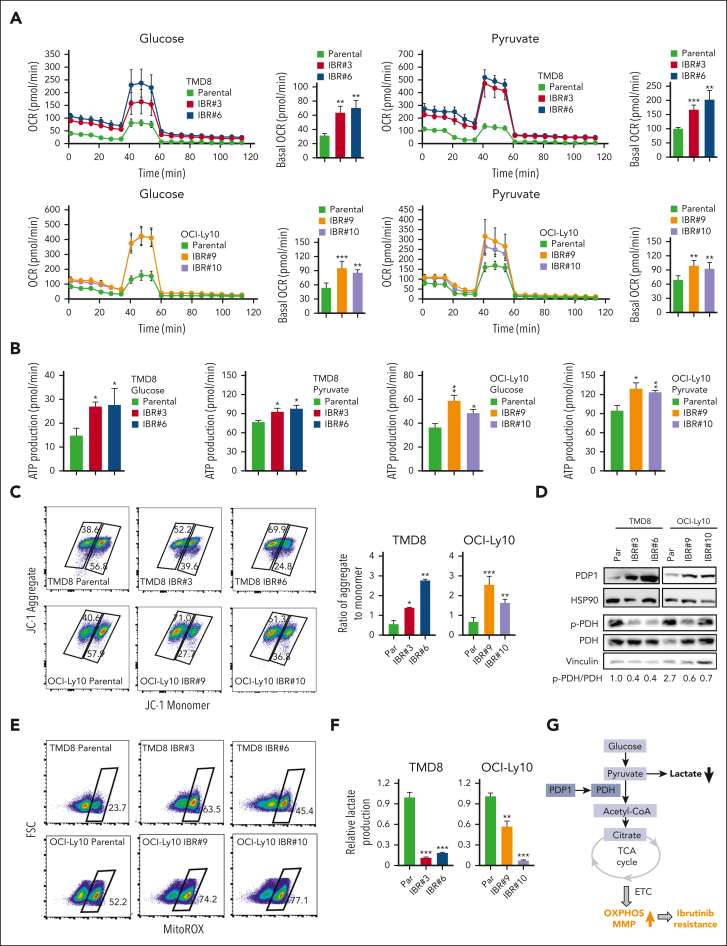
Figure 4.
Metabolic reprogramming to OXPHOS is a hallmark of ibrutinib resistance. (A) OCRs were determined by a Seahorse XFe96 extracellular flux analyzer. Increased basal OCRs in IBRs compared with Par cells. Error bars represent mean ± SD (∗∗P < .01; ∗∗∗P < .001; n = 3). (B) Increased ATP production in IBRs compared with that in the Par cells. Error bars represent mean ± SD (∗P < .05; ∗∗P < .01; n = 3). (C) Flow cytometric analyses of MMP by incorporation of 5,5,6,6'-tetrachloro-1,1',3,3' tetraethylbenzimi-dazoylcarbocyanine iodide (JC1) dye. The ratio of aggregate to monomer is shown. Error bars represent mean ± SD (∗P < .05; ∗∗P < .01; ∗∗∗P < .001; n = 3). (D) Immunoblot analysis of PDP1, p-PDH, and PDH. HSP90 or vinculin served as a loading control. (E) Flow cytometric analysis of reactive oxygen species (ROS) production using MitoSOX dye. Data represent 3 independent experiments. (F) Reduced relative lactate production in IBRs compared with that in the Par cells. Error bars represent mean ± SD (∗∗P < .01; ∗∗∗P < .001; n = 3). (G) Schematic illustration of metabolic reprogramming to OXPHOS in ibrutinib resistance. ETC, electron transport chain; FSC, forward scatter; LDH, lactate dehydrogenase; TCA, trichloroacetic acid.

