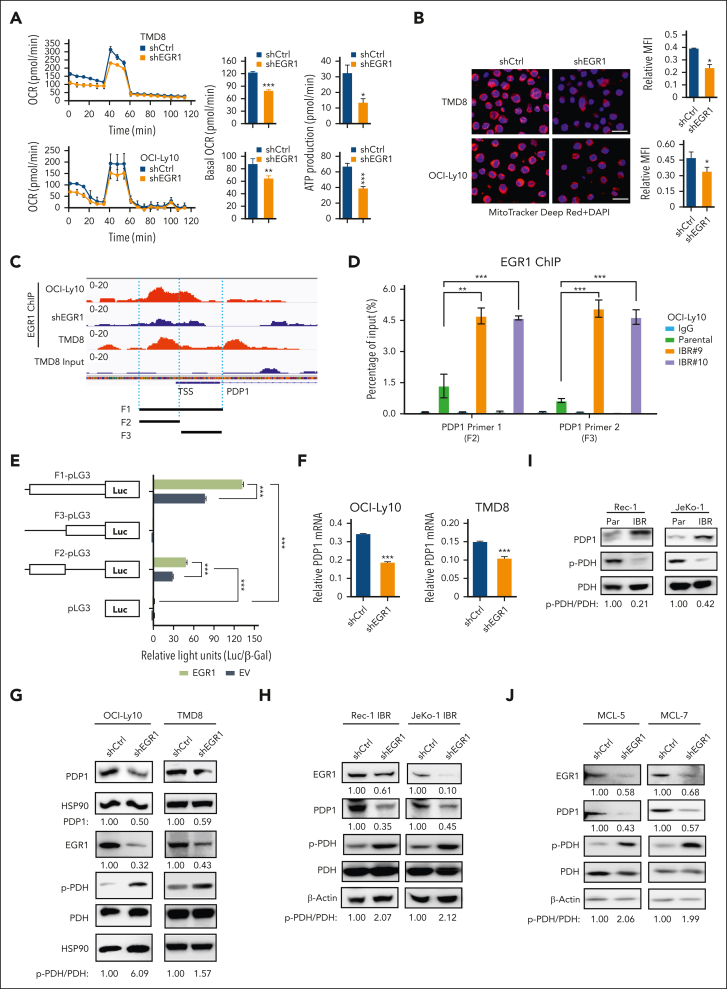
Figure 5.
EGR1 upregulates PDP1 expression to promote OXPHOS. (A) OCRs were determined by Seahorse XFe96 extracellular flux analyzer. Reduced basal OCR and ATP production after EGR1 knockdown in ABC DLBCL cells. Error bars represent mean ± SD of 3 replicates (∗P < .05; ∗∗P < .01; ∗∗∗P < .001). (B) Reduced MMP after EGR1 knockdown. Representative images of colocalized mitochondrial tracker Deep Red and 4′,6-diamidino-2-phenylindole (DAPI) nuclear staining in the indicated cells. Mean fluorescence intensity (MFI) of MitoTracker Deep Red relative to DAPI nuclear DNA staining was determined by NIH ImageJ. Error bars represent mean ± SD (∗P < .05; n = 3). Scale bar, 20 μm. (C) EGR1 ChIP-seq data show EGR1 binding peaks on the PDP1 promoter region. (D) EGR1 ChIP-qPCR analysis with 2 pairs of primers (F2 and F3) for the PDP1 promoter core regions. IgG served as a control. Error bars represent mean ± SD (∗∗P < .01; ∗∗∗P < .001; n = 3). (E) EGR1 induces PDP1 transcription by a standard dual luciferase reporter gene assay in 293T cells (∗∗∗P < .001; n = 3). Firefly luciferase activity from the pGL3 basic reporter was normalized with β-galactosidase activity. (F) Real-time PCR for PDP1 mRNA expression relative to β-actin. Error bars represent mean ± SD of 3 replicates (∗∗∗P < .001). (G) Immunoblot analysis of PDP1, p-PDH, and PDH expression after EGR1 knockdown in ABC DLBCL cells. HSP90 served as a loading control. (H) Immunoblot analysis of PDP1, p-PDH, and PDH expression after EGR1 knockdown in the ibrutinib-resistant MCL cell lines. β-actin served as a loading control. (I) Immunoblot analysis of PDP1, p-PDH, and PDH expression in MCL parental and ibrutinib-resistant cells. β-actin served as a loading control. (J) Immunoblot analysis of PDP1, p-PDH, and PDH expression after EGR1 knockdown in the ibrutinib-resistant primary MCL cells. β-actin served as a loading control. TSS, transcription start site.

