Figure 6.
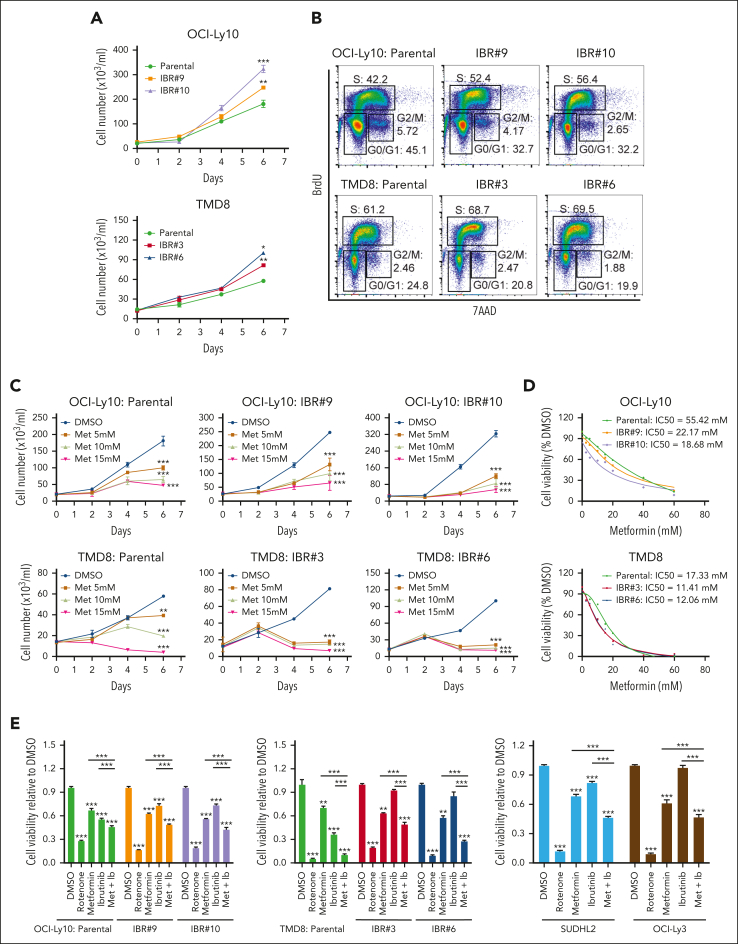
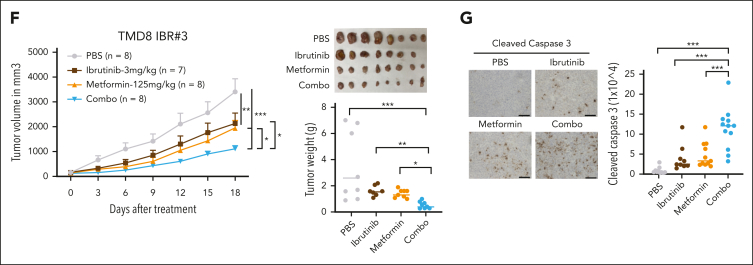
Metformin inhibits the proliferation and growth of ibrutinib-resistant cells. (A) The advantage of ibrutinib-resistant cells in cell growth over parental cells. The cell number was counted by trypan blue staining. Error bars represent mean ± SD of 3 replicates (∗P < .05; ∗∗P < .01; ∗∗∗P < .001). (B) Cell cycle analysis by flow cytometry after 4 hours of BrdU incorporation in the indicated cell lines. Data represent 3 independent experiments. (C) Reduced cell number after metformin treatment in parental and resistant cells by trypan blue staining. Error bars represent mean ± SD (∗∗P < .01; ∗∗∗P < .001; n = 3). (D) The resistant cells are more sensitive to metformin treatment than parental cells, based on the CellTiter-Glo luminescent cell viability assay. IC50 was calculated by GraphPad Prism (9.0) using a 4-parameter nonlinear regression model. (E) CellTiter-Glo luminescent cell viability assay shows that metformin restores the sensitivity of the resistant cells to ibrutinib treatment. Cells were treated with 1 μM rotenone (control), 5 mM metformin, 10 nM ibrutinib, or a combination of metformin and ibrutinib. Rotenone was used as a strong inhibitor of complex I of the mitochondrial respiratory chain (MRC). SUDHL2 and OCI-Ly3 are primary ibrutinib-resistant cells. Error bars represent mean ± SD (one-way ANOVA, ∗P < .05; ∗∗P < .01; ∗∗∗P < .001; n = 3). (F) Ibrutinib-resistant ABC DLBCL xenografts. TMD8 ibrutinib-resistant cells were established as a subcutaneous tumor (average, 150 mm3) in NSG mice and then treated with 3 mg/kg ibrutinib (intraperitoneally) daily, 125 mg/kg metformin (met; intraperitoneally) daily, or with a combination of the 2 drugs until the end point (day 18). Error bars represent mean ± SEM (two-way ANOVA, ∗P < .05; ∗∗ P < .01; ∗∗∗P < .001). (G) Immunohistochemical analysis of cleaved caspase 3 in tumor tissues (∗∗∗P < .001). Representative images of each group are shown. Scale bar, 100 μm. Combo, combination.


