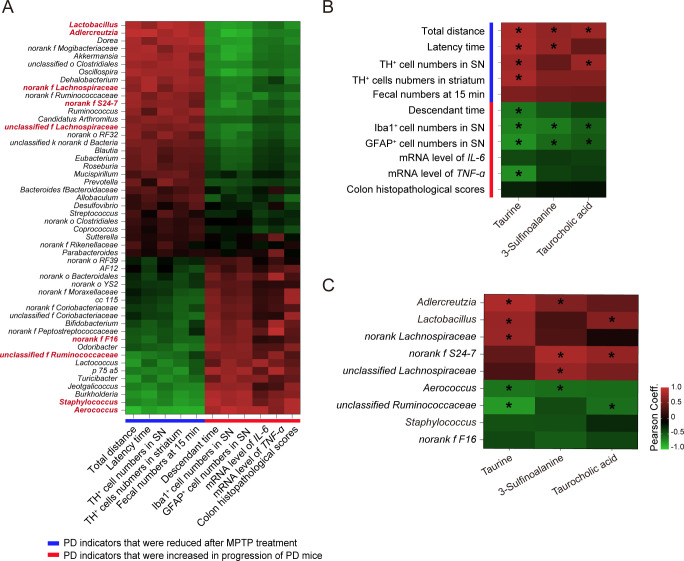
Fig 5.
Correlations between changes in gut microbiota profile, serum metabolism alterations, and PD-related pathological results. (A) Heatmap of Pearson’s correlation coefficients between the abundances of top 50 genera and PD-associated results. Bacterial groups in red represent the top 10 altered genera. (B) Heatmap of Pearson’s correlation coefficients between PD-associated results and levels of differential metabolites in taurine metabolism pathway. (C) Heatmap of Pearson’s correlation coefficients between the abundances of vital gut flora and taurine metabolism-associated metabolites. Vital gut flora was identified as top 10 altered genera with Pearson’s correlation coefficient of >0.5. Pearson’s correlation coefficients are shown by color. Red indicates a negative correlation, and the blue indicates a positive correlation between two variables. *P < 0.05.

