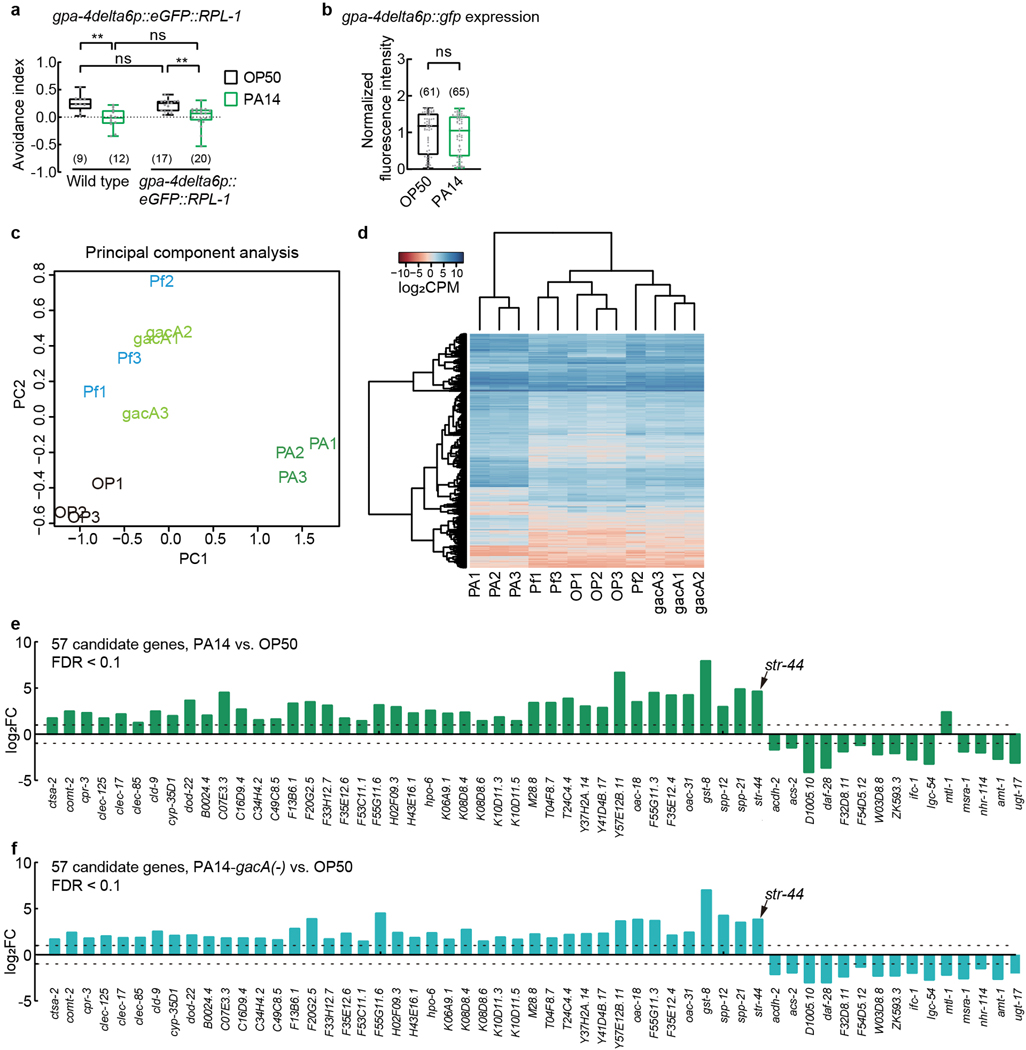
Extended Data Fig. 6. TRAP-RNAseq analysis on AWA neurons in worms exposed to OP50, or PA14, or PA14-gacA(−), or P. fluorescens.
a, Avoidance of ascaroside pheromones in adult transgenic hermaphrodites expressing eGFP::RPL-1 selectively in AWA using gpa-4delta6p promoter exposed to OP50 or PA14 for 4–6 hours. Pheromones, mixture of ascr#2,3,5 (10 nM each at equilibrium). Positive avoidance index, avoidance. Box plot, median, 1st and 3rd quartiles; whiskers, minimum and maximum. Numbers in parenthesis, numbers of individual assays. Dots, avoidance indexes of individual assays. P values are derived from Two-way ANOVA with Tukey’s multiple comparisons test, asterisks indicate significant difference, ** P < 0.01, ns, not significant. P values are shown in Source data.
b, Expression of a transcriptional reporter using an AWA-specific promoter (gpa-4delta6p) in adult transgenic hermaphrodites exposed to OP50 or PA14 for 4–6 hours. Intensity of fluorescence signals is normalized using average intensity of AWA expression of gpa-4delta6p::gfp in OP50-exposed worms measured in parallel. Box plot, median, 1st and 3rd quartiles; whiskers, minimum and maximum. Numbers in parenthesis, numbers of individual neurons. Dots, signals of individual neurons. P values are derived from two-tailed Mann-Whitney test, ns, not significant. P values are shown in Source data.
c, d, Principal component analysis (c) and hierarchical clustering of samples (d) based on the expression of 806 genes that were differentially expressed in AWA neurons under 4 conditions (exposure to OP50, or PA14, or PA14-gacA(−), or P. fluorescens). log2CPM (counts per million) values calculated using cpm function in edgeR package represent expression levels. OP1–3, samples 1–3 for OP50-exposed hermaphrodites; PA1–3, samples 1–3 for PA14-exposed hermaphrodites; gacA1–3, samples 1–3 for PA14-gacA(−)-exposed hermaphrodites; Pf1–3, samples 1–3 for P. fluorescens-exposed hermaphrodites.
e, f, Expression levels of 57 genes showing differential expression between PA14-exposed worms and OP50-exposed worms (e, FDR < 0.1) and differential expression between PA14-gacA(−)-exposed worms and OP50-exposed worms (f, FDR < 0.1), but showing no difference between P. fluorescens-exposed worms and OP50-exposed worms. Dashed lines indicate 1 or −1. FC, fold change (in comparison with expression in OP50-exposed worms). P values and FDR are shown in Supplementary Data 5.

