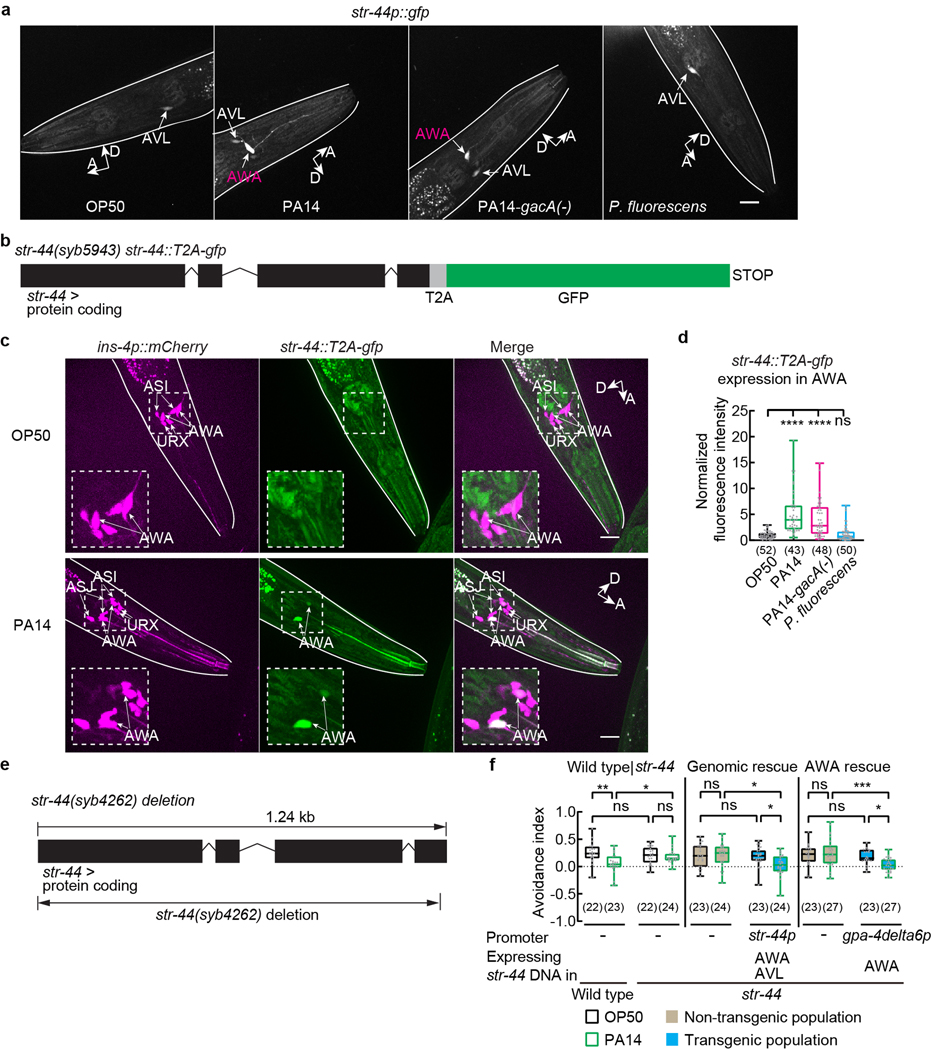
Extended Data Fig. 7. Exposure to PA14 or PA14-gacA(−) induces expression of str-44 in AWA and analysis of str-44 function in pheromone response.
a, Sample images of adult transgenic hermaphrodites expressing str-44p::gfp exposed to OP50, PA14, PA14-gacA(−) or P. fluorescens for 4–6 hours. Arrows indicate neuronal cell bodies. Lines outline worm bodies. Scale bar (applicable to images in the same row), 20 μm. A, anterior. D, dorsal.
b, Schematics showing the allele str-44(syb5943) that contains the str-44 genomic locus tagged with sequences of T2A peptide and GFP. Boxes indicate protein coding exons.
c, Sample images of AWA expression of str-44::T2A-gfp in adult str-44(syb5943) hermaphrodites containing the str-44 genomic locus tagged with a gfp sequence when exposed to OP50 or PA14 for 4–6 hours. Dashed lines indicate enlarged views. Arrows indicate neuronal cell bodies. Lines outline worm bodies. Scale bar, 20 μm. A, anterior. D, dorsal (arrows point slightly out of the page).
d, Quantitation of AWA expression of str-44::T2A-gfp in adult str-44(syb5943) hermaphrodites containing the str-44 genomic locus tagged with a gfp sequence when exposed to OP50, PA14, PA14-gacA(−) or P. fluorescens for 4–6 hours. Intensity of fluorescence signals is normalized using average intensity of AWA expression of str-44::T2A-gfp in OP50-exposed worms measured in parallel. Box plot, median, 1st and 3rd quartiles; whiskers, minimum and maximum. Numbers in parenthesis, number of individual neurons. Dots, signals of individual neurons. P values are derived from Kruskal-Wallis test with Dunn’s multiple comparisons test, asterisks indicate significant difference, **** P < 0.0001, ns, not significant. P values are shown in Source data.
e, Schematics showing the deletion mutation in the str-44(syb4262) allele.
f, Avoidance index in wild-type and str-44 mutant adult hermaphrodites, and transgenic adult hermaphrodites expressing a wild-type str-44 DNA using either str-44 promoter or AWA-specific promoter gpa-4deta6p in str-44 mutant background exposed to OP50 or PA14. Pheromones, mixture of ascr#2,3,5 (10 nM each at equilibrium). Positive avoidance index, avoidance. Box plot, median, 1st and 3rd quartiles; whiskers, minimum and maximum. Numbers in parenthesis, number of individual assays. Dots, avoidance indexes of individual assays. P values are derived from Two-way ANOVA with Tukey’s multiple comparisons test, asterisks indicate significant difference, *** P < 0.001, ** P < 0.01, * P < 0.05, ns, not significant. P values are shown in Source data.

