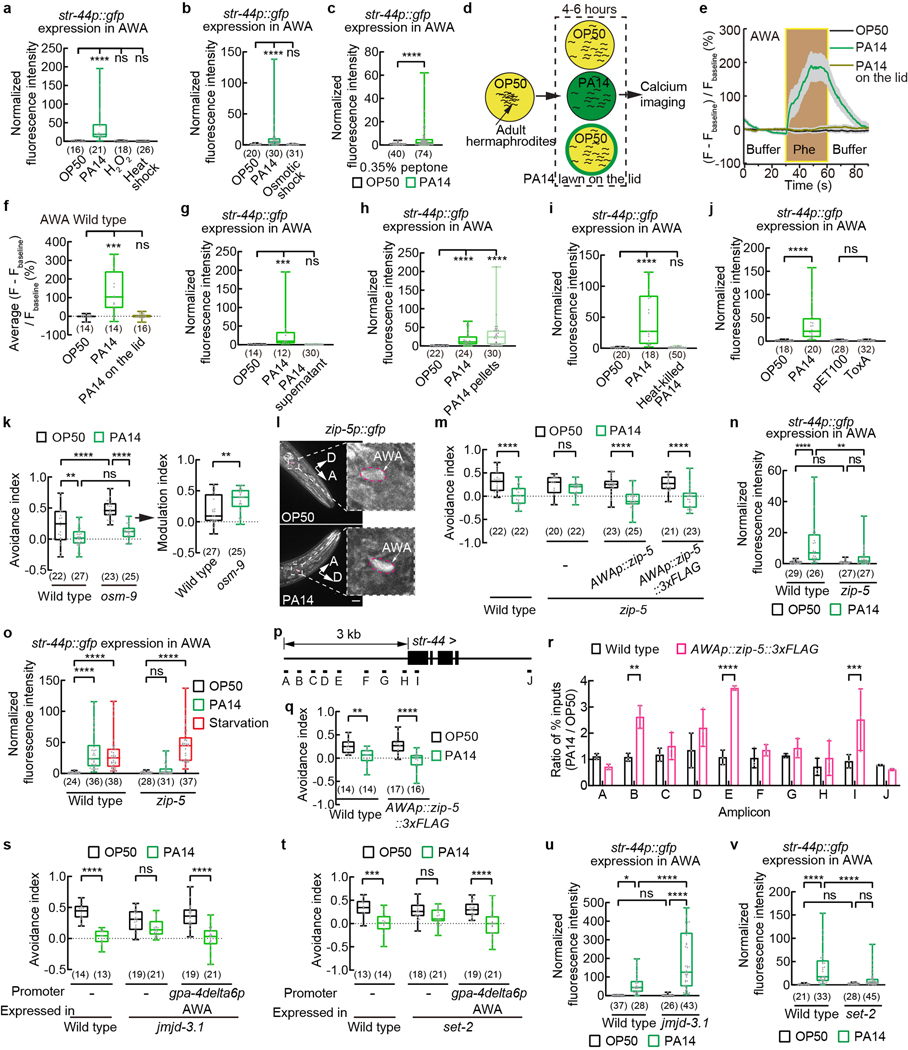
Extended Data Fig. 8. AWA expression of str-44 is regulated by biological features associated with live PA14 cells and the function of zip-5, jmjd-3.1 and set-2 in AWA.
a - c, Quantitation of str-44p::gfp signals in AWA in adult hermaphrodites exposed to OP50 or PA14 for 4–6 hours, or to a heat shock at 32⁰C for 8 hours, or to 10 mM hydrogen peroxide for 24 hours (a), or to a osmotic shock at 300 mOsm for 24 hours (b), or to OP50 and PA14 cultivated under conditions that induce a higher level of virulence in PA14 (c, Methods). Intensity of fluorescence signals is normalized using average intensity of str-44p::gfp in OP50-exposed worms measured in parallel.
d, Cartoon for exposure to PA14 odorants by placing a lawn of PA14 on the lid.
e, f, Traces of GCaMP6 signals in AWA neurons of wild-type adult hermaphrodites in response to pheromones after 4 to 6-hour exposure to OP50, or PA14, or PA14 odorants (a lawn of PA14 on the lid) (e) and quantitation of average GCaMP6 signals in AWA during pheromone stimulation (f). Phe, pheromone mixture of ascr#2,3,5 (1 μM each). Lines in traces, mean. Shades, s.e.m.. Fbaseline, average GCaMP6 signals in the first 30 seconds.
g - j, Exposure to supernatant of PA14 culture does not induce AWA expression of str-44p::gfp (g), but exposure to PA14 cells with supernatant removed does (h); and heat-killing of PA14 cells abolishes the induction (i). Exposure to E. coli expressing the exotoxin ToxA of PA14 also does not induce str-44 expression (j). Intensity of fluorescence signals is normalized using average intensity of str-44p::gfp in OP50-exposed worms measured in parallel. pET100, cloning vector for ToxA.
k, m, q, s, t, Avoidance of pheromones in wild-type, osm-9 mutant (k), zip-5 mutant (m), jmjd-3.1 mutant (s), or set-2 mutant (t) adult hermaphrodites, or in transgenic adult hermaphrodites specifically expressing in AWA a wild-type zip-5 DNA or a wild-type zip-5 DNA tagged with a sequence of 3xFLAG in zip-5 mutant background (m), or in transgenic adult hermaphrodites specifically expressing in AWA a wild-type zip-5 DNA tagged with a sequence of 3xFLAG in wild-type background (q), or in transgenic adult hermaphrodites expressing specifically in AWA a wild-type jmjd-3.1 DNA or a wild-type set-2 DNA in the respective mutant background (s,t) when exposed to OP50 or PA14 (avoidance indexes in q were measured during sample collection for ChIP-qPCR assays), and modulation of pheromone avoidance by PA14 (k). Pheromones, mixture of ascr#2,3,5 (10 nM each at equilibrium). Positive avoidance index, avoidance. Positive modulation index, suppression of avoidance by PA14 exposure.
l, Sample images of adult transgenic hermaphrodites expressing zip-5p::gfp exposed to OP50 or PA14 for 4–6 hours. Dashed lines indicate enlarged views. Arrows indicate neuronal cell bodies. Scale bar, 20 μm. A, anterior. D, dorsal.
n, o, u, v, Quantitation of str-44p::gfp signals in AWA in wild-type and zip-5 mutant adult hermaphrodites when exposed to OP50 or PA14 for 4–6 hours (n), or in wild-type and zip-5 mutant adult hermaphrodites when exposed to OP50 or PA14 for 4–6 hours or starved for 5 hours (o), or in jmjd-3.1 mutant (u) or set-2 mutant (v) hermaphrodites exposed to OP50 or PA14. Intensity of fluorescence signals is normalized using average intensity of str-44p::gfp in OP50-exposed wild-type worms measured in parallel.
p, Diagram of qPCR amplicon positions on str-44 genomic locus in ChIP assays for association of ZIP-5::3xFLAG with str-44 sequence.
r, Ratio of ChIP signal (% of input) in PA14 versus OP50-exposed animals. n = 3 independent assays, mean ± SD. Dots, ratios of individual assays. P values are derived from Two-way ANOVA with Bonferroni’s multiple comparisons test, asterisks indicate significant difference, **** P < 0.0001, *** P < 0.001, ** P < 0.01. P values are shown in Source data.
Box plot, median, 1st and 3rd quartiles; whiskers, minimum and maximum. Numbers in parenthesis, number of individual neurons (a-c,g-j,n,o,u,v) or individual worms (f) or individual assays (k,m,q,s,t). Dots, signals of individual neurons (a-c,g-j,n,o,u,v) or individual worms (f), or avoidance indexes (k,m,q,s,t) or modulation indexes (k) of individual assays. P values are derived from Kruskal-Wallis test with Dunn’s multiple comparisons test (a,b,f-j) or two-tailed Mann-Whitney test (c) or Two-way ANOVA with Tukey’s multiple comparisons test [(avoidance index in k),n,o,q,u,v] or Two-way ANOVA with Bonferroni’s multiple comparisons test (m,s,t) or two-tailed unpaired t test (modulation index in k), asterisks indicate significant difference, **** P < 0.0001, *** P < 0.001, ** P < 0.01, * P < 0.05, ns, not significant. P values are shown in Source data.

