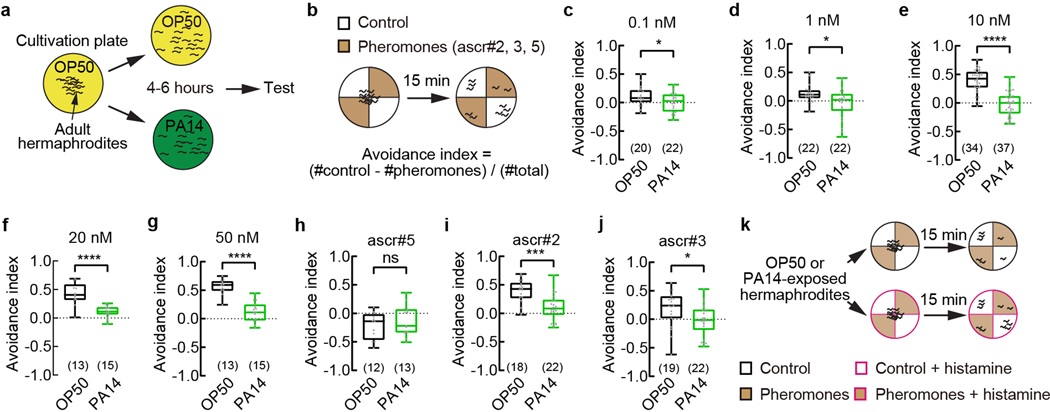
Extended Data Fig. 1. Pathogen exposure suppresses avoidance of ascaroside pheromones.
a, b, k, Schematics for bacteria exposure (a), chemotaxis assay on ascaroside pheromones (b), and histamine treatment during chemotaxis (k).
c – j, Avoidance of the mixture of ascaroside pheromones ascr#2,3,5 over a range of concentrations (c-g) or avoidance of individual ascarosides (h-j, 10 nM each at equilibrium) in wild-type adult hermaphrodites when exposed to E. coli OP50 or P. aeruginosa PA14. Positive avoidance index, avoidance. Box plot, median, 1st and 3rd quartiles; whiskers, minimum and maximum. Numbers in parenthesis, number of individual assays. Dots, avoidance indexes of individual assays. P values are derived from two-tailed unpaired t test, asterisks indicate significant difference, **** P < 0.0001, *** P < 0.001, * P < 0.05, ns, not significant. P values are shown in Source data.

