Figure 1.
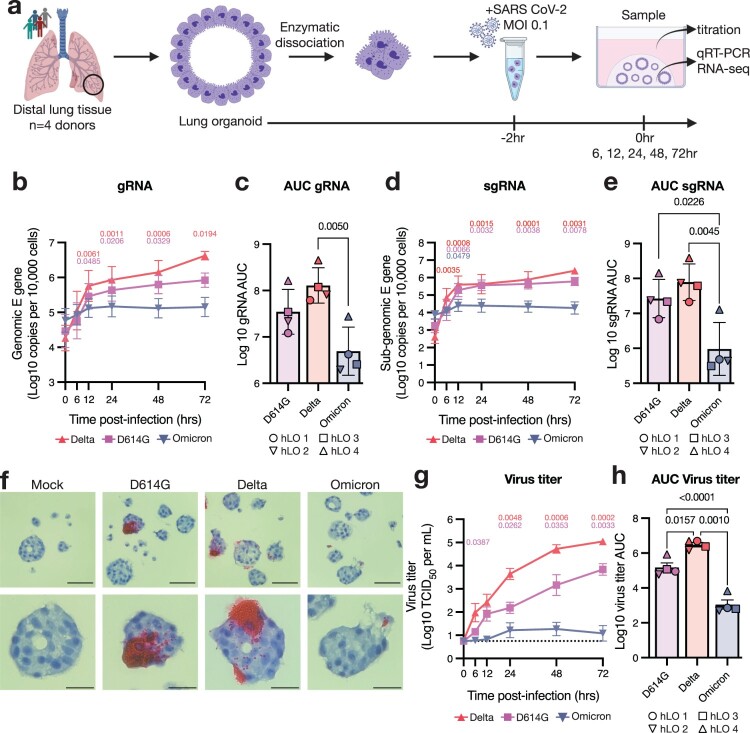
SARS-CoV-2 VOCs Delta and D614G productively infect hLOs, while Omicron is attenuated. (a) Schematic of hLO infection. Viral load in infected hLOs was measured by qRT-PCR for gRNA (b–c) or sgRNA (d-e) and averaged across hLOs from four donors. In each run, standard dilutions of counted RNA standards were run in parallel to calculate copy numbers in the samples. gRNA (c) or sgRNA (e) copy numbers over time were used to calculate area under the curve (AUC) relative to 0 h post-inoculation for each donor. (f) In situ hybridization against SARS-CoV-2 spike RNA was conducted in FFPE sections of hLOs 72 h post-inoculation. hLO 1 is shown. Scale bars denote 50 μm (upper panels) or 20 μm (lower panels). (g) Virus titers in the culture supernatant were quantified, and averaged across hLOs from four donors. Dotted line indicates lower limit of detection. (h) Virus titer over time was used to calculate AUC for each donor. Error bars denote mean +/− SEM. Statistical analysis was performed using two-way ANOVA with Dunnett’s post-test (b, d, g) or ordinary one-way ANOVA with Tukey’s post-test (c, e, h). P-values denote difference vs 0 h post-inoculation (b, d, g). P-values <0.05 are shown.

