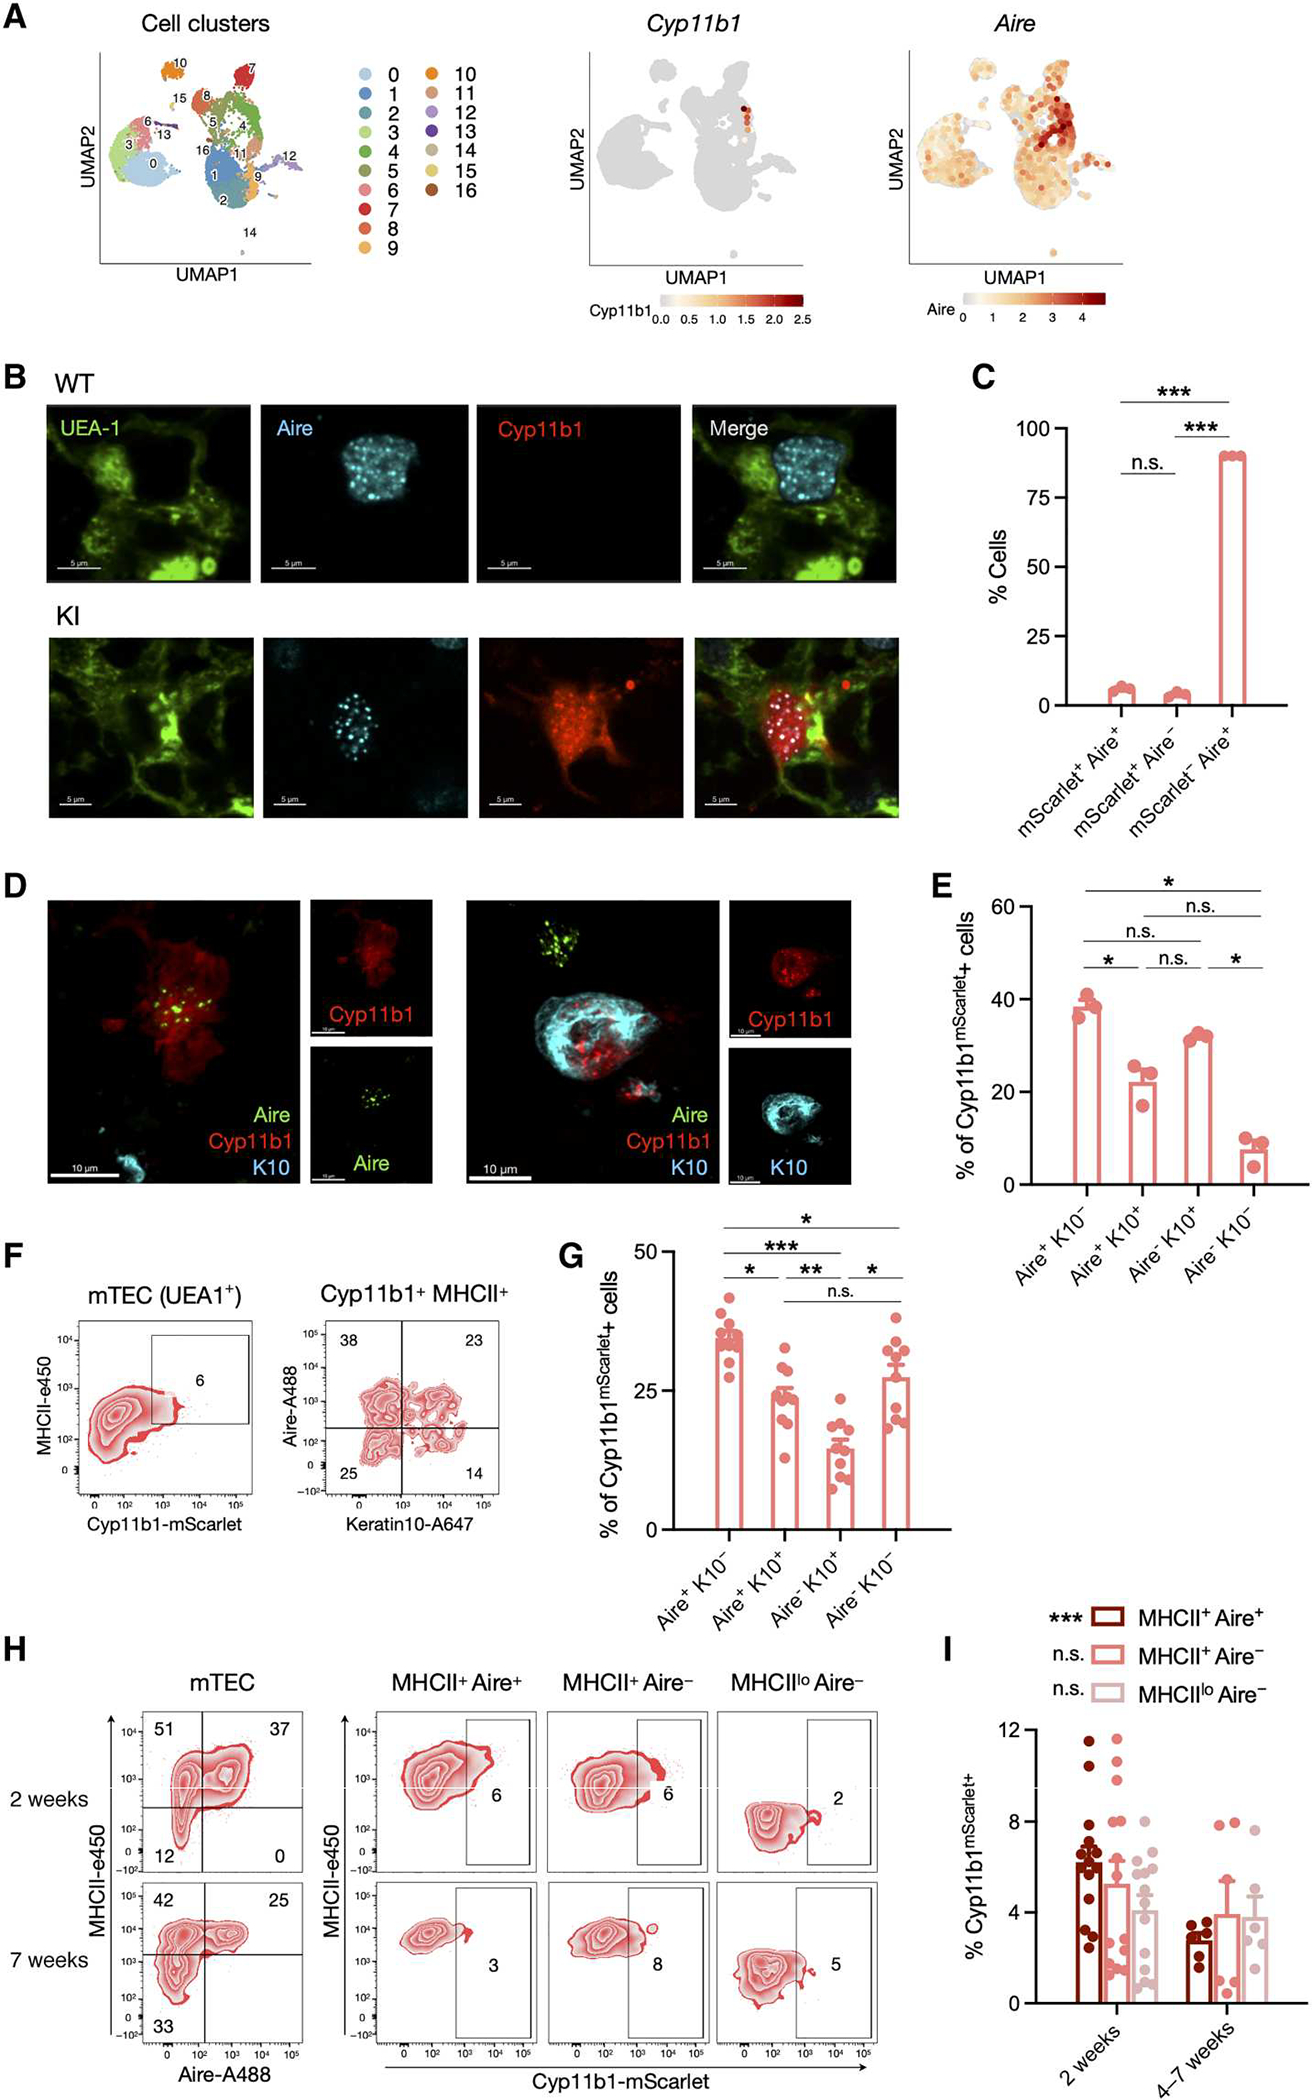
Fig. 2. Cyp11b1 is expressed by Aire+ mTECs and keratin 10+ post-Aire mTECs.

(A) Single-cell transcriptomes from sorted Pdpn− CD104− mTEClo (32) were analyzed for expression of Cyp11b1 and Aire, and the relative expression, indicated by the color scale, was mapped onto a UMAP plot. Numbered populations indicate different cTEC and mTEC cell populations as defined in fig. S4. (B) Thymi from 1-week-old WT and Cyp11b1mScarlet KI mice were fixed, stained for Ly51 (cortex), UEA-1 (medulla), mScarlet-Atto 565, and Aire. Confocal images were taken at ×60 oil immersion magnification. (C) Data from 3936 Aire+ and/or mScarlet+ cells (114 fields from three KI mice) collected as in (B) were analyzed for coexpression of Aire and Cyp11b1mScarlet, shown as mean ± SEM. (D) Thymi from 2-week-old KI mice were fixed and stained for Aire (Alexa Fluor 488), keratin 10 (K10, Alexa Fluor 647), and Cyp11b1mScarlet (Atto 565), and confocal images were taken at ×60 oil immersion magnification. (E) Data from 872 Cyp11b1mScarlet+ cells (114 fields from three KI mice) collected as in (D) were analyzed for expression of Aire and keratin 10. (F) Thymi from 2-week-old KI mice were digested, and cells were analyzed by flow cytometry. Representative contour plots showing mTEC (CD45−EpCAM+UEA1+; left) and Cyp11b1-mScarlet+ MHCIIhi mTEC (right) subsets. (G) Pooled data for samples analyzed as in (F) of 10 KI mice from two independent experiments, presented as mean ± SEM. (H) Thymi collected from 2- and 7-week-old KI mice were digested, and cells were analyzed by flow cytometry. Representative contour plots show Cyp11b1 expression in MHCII+Aire+, MHCII+Aire−, and MHCIIloAire− mTEC (CD45−EpCAM+UEA1+) cell subsets. (I) Pooled data collected and analyzed as in (H), from four independent experiments with 2-week-old (N = 14) and 4- to 7-week-old (N = 6) mice, presented as mean ± SEM. P values were calculated using a mixed linear model analysis (*P < 0.05). Significance in (C), (E), (G), and (I) was assessed using mixed linear models with post hoc paired t tests applying Holm-Šidák corrections for multiple comparisons. *P < 0.05, **P < 0.01, and ***P < 0.001; n.s., not significant.
