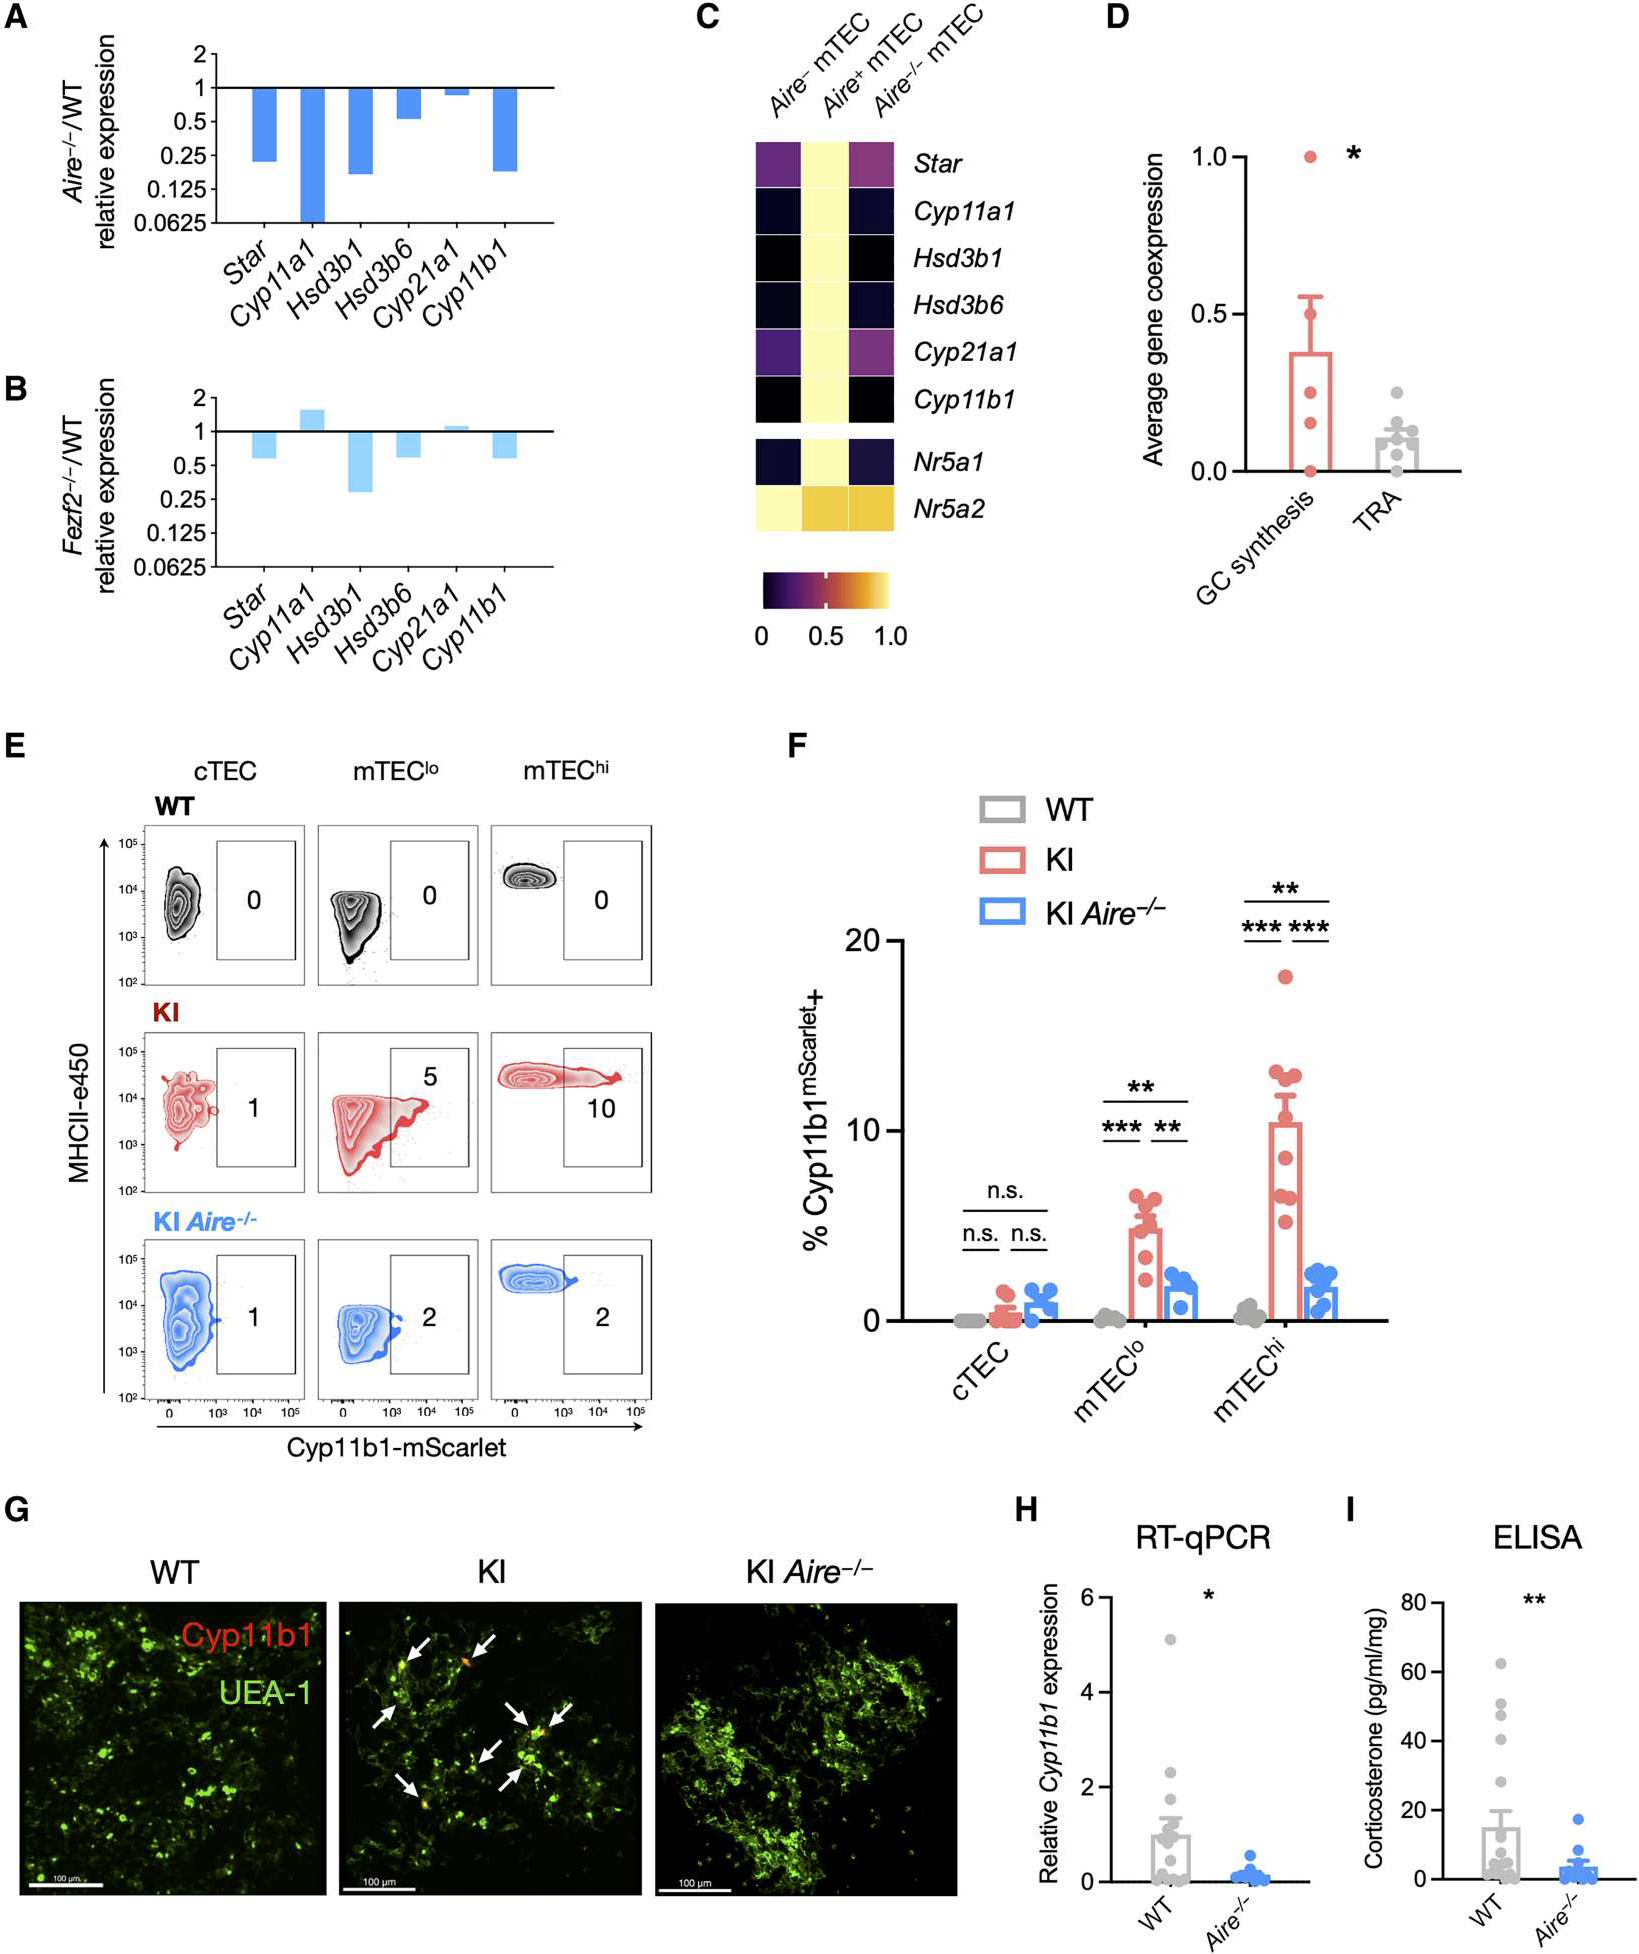
Fig. 3. Aire is required for mTEC glucocorticoid synthesis.

(A) Gene expression of glucocorticoid biosynthetic enzyme genes in mTEC cells of WT and Aire−/− mice. Bulk RNA-seq data from Aire−/− mTEC are shown for each gene relative to WT expression of the same gene. (B) Gene expression of glucocorticoid biosynthetic enzyme genes in mTEC cells of WT and Fezf2−/− mice. Bulk RNA-seq data from Fezf2−/− mTEC are shown for each gene relative to WT expression of the same gene. (C) Expression of glucocorticoid biosynthetic enzyme genes in bulk mTEC subset samples of WT and Aire−/− mice. The expression level of each gene is presented as a proportion of its maximal expression (1.0) across analyzed cell types as indicated by the color scale. (D) Single-cell transcriptomes obtained from deep sequencing of 174 mTECs were analyzed for the coincident expression of glucocorticoid synthesis genes (Star, Cyp11a1, Hsd3b6, Cyp21a1, and Cyp11b1) with each other or with Aire- and Fezf2-dependent TRA genes (Ins1, Spt1, Mup4, S100a8, Resp18, Rabp9, Krt10, and Maoa) in the same cell (see Materials and Methods for calculation details). Data are presented as means ± SEM. (E) Thymi from 2-week-old WT, KI, and KI Aire−/− mice were digested and cells analyzed by flow cytometry. Representative contour plots show each subset, and numbers indicate the percentage of cells within the Cyp11b1mScarlet+ gate. (F) Data collected and analyzed as in (E), pooled from two experiments with 2- and 3-week-old mice, presented as means ± SEM. Data in (E) and (F) are representative or pooled from two independent experiments with N = 7 WT, 9 KI, and 7 KI Aire−/− mice. (G) WT, KI, and KI Aire−/− thymi from 1-week-old mice were fixed, sectioned, and stained for UEA-1 (mTEC, FITC) and Cyp11b1mScarlet (Atto 565). Confocal images were taken at ×60 oil immersion magnification and are representative of two independent experiments. Scale bars, 100 μm. (H) Total RNAwas extracted from whole thymus lobes of WT and Aire−/− mice, and RT-qPCR was used to quantify Cyp11b1 gene expression. Expression was normalized to 18S RNA and is shown relative to WT expression. Data are pooled from four independent experiments, shown as means ± SEM with N = 17 WT and 9 Aire−/− thymi. (I) Thymus lobes were dissected, minced, and cultured for 72 hours in steroid-free medium. Supernatants were collected, and corticosterone was quantified by a commercial ELISA kit. Data are pooled from four independent experiments, with N = 19 WT and 11 Aire−/− thymi. Statistical significance in (D), (H), and (I) was determined by one-tailed t tests and that in (F) was determined by a mixed linear model with post hoc unpaired t tests applying the Holm-Šidák correction for multiple comparisons. *P < 0.05, **P < 0.01, and ***P < 0.001. n.s., not significant.
