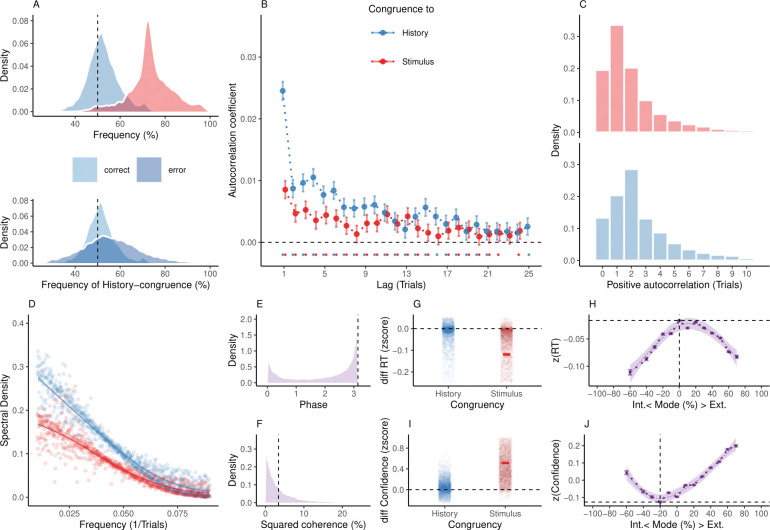
Fig 2. Internal and external modes in human perceptual decision-making.
(A) In humans, perception was stimulus-congruent in 73.46% ± 0.15% (in red) and history-congruent in 52.7% ± 0.12% of trials (in blue; upper panel). History-congruent perceptual choices were more frequent when perception was stimulus-incongruent (i.e., on error trials; lower panel), indicating that history effects impair performance in randomized psychophysical designs. (B) Relative to randomly permuted data, we found highly significant autocorrelations of stimulus-congruence and history-congruence (dots indicate intercepts ≠ 0 in trial-wise linear mixed effects modeling at p < 0.05). Across trials, the autocorrelation coefficients were best fit by an exponential function (adjusted R2 for stimulus-congruence: 0.53; history-congruence: 0.72) as compared to a linear function (adjusted R2 for stimulus-congruence: 0.53; history-congruence: 0.51), decaying at a rate of γ = −1.92×10⁻³ ± 4.5×10⁻⁴ (T(6.88×10⁴) = −4.27, p = 1.98×10⁻⁵) for stimulus-congruence and at a rate of γ = −6.11×10⁻³ ± 5.69×10⁻⁴ (T(6.75×10⁴) = −10.74, p = 7.18×10⁻²⁷) for history-congruence. (C) Here, we depict the number of consecutive trials at which autocorrelation coefficients exceeded the respective autocorrelation of randomly permuted data within individual participants. For stimulus-congruence (upper panel), the lag of positive autocorrelation amounted to 3.24 ± 2.39×10⁻³ on average, showing a peak at trial t+1 after the index trial. For history-congruence (lower panel), the lag of positive autocorrelation amounted to 4.87 ± 3.36×10⁻³ on average, peaking at trial t+2 after the index trial. (D) The smoothed probabilities of stimulus- and history-congruence (sliding windows of ±5 trials) fluctuated as a scale-invariant process with a 1/f power law, i.e., at power densities that were inversely proportional to the frequency. (E) The distribution of phase shift between fluctuations in stimulus- and history-congruence peaked at half a cycle (π denoted by dotted line). (F) The average squared coherence between fluctuations in stimulus- and history-congruence (dotted line) amounted to 6.49 ± 2.07×10⁻³%. (G) We observed faster RTs for both stimulus-congruence (as opposed to stimulus-incongruence, β = −0.14 ± 1.6×10⁻³, T(1.99×10⁶) = −85.84, p < 2.2×10−308) and history-congruence (β = −9.56×10⁻³ ± 1.37×10⁻³, T(1.98×10⁶) = −6.97, p = 3.15×10⁻¹²). (H) The mode of perceptual processing (i.e., the difference between the smoothed probability of stimulus- vs. history-congruence) showed a quadratic relationship to RTs, with faster RTs for stronger biases toward both external sensory information and internal predictions provided by perceptual history (β2 = −19.86 ± 0.52, T(1.98×10⁶) = −38.43, p = 5×10−323). The horizontal and vertical dotted lines indicate maximum RT and the associated mode, respectively. (I) Confidence was enhanced for both stimulus-congruence (as opposed to stimulus-incongruence, β = 0.48 ± 1.38×10⁻³, T(2.06×10⁶) = 351.54, p < 2.2×10−308) and history-congruence (β = 0.04 ± 1.18×10⁻³, T(2.06×10⁶) = 36.85, p = 3.25×10−297). (J) In analogy to RTs, we found a quadratic relationship between the mode of perceptual processing and confidence, which increased when both externally and internally biased modes grew stronger (β2 = 39.3 ± 0.94, T(2.06×10⁶) = 41.95, p < 2.2×10−308). The horizontal and vertical dotted lines indicate minimum confidence and the associated mode, respectively.

