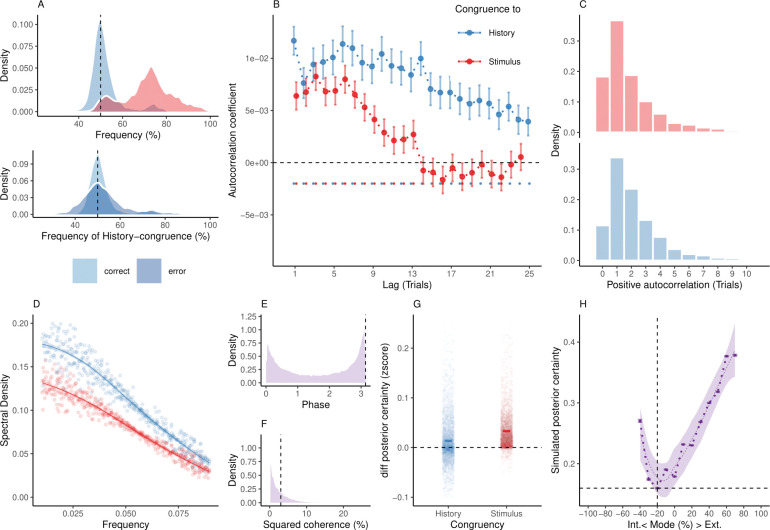
Fig 4. Internal and external modes in simulated perceptual decision-making.
(A) Simulated perceptual choices were stimulus-congruent in 71.36% ± 0.17% (in red) and history-congruent in 51.99% ± 0.11% of trials (in blue; T(4.32×10³) = 17.42, p = 9.89×10−66; upper panel). Due to the competition between stimulus- and history-congruence, history-congruent perceptual choices were more frequent when perception was stimulus-incongruent (i.e., on error trials; T(4.32×10³) = 11.19, p = 1.17×10⁻²⁸; lower panel) and thus impaired performance in the randomized psychophysical design simulated here. (B) At the simulated group level, we found significant autocorrelations in both stimulus-congruence (13 consecutive trials) and history-congruence (30 consecutive trials). (C) On the level of individual simulated participants, autocorrelation coefficients exceeded the autocorrelation coefficients of randomly permuted data within a lag of 2.46 ± 1.17×10⁻³ trials for stimulus-congruence and 4.24 ± 1.85×10⁻³ trials for history-congruence. (D) The smoothed probabilities of stimulus- and history-congruence (sliding windows of ±5 trials) fluctuated as a scale-invariant process with a 1/f power law, i.e., at power densities that were inversely proportional to the frequency (power ∼ 1/fβ; stimulus-congruence: β = −0.81 ± 1.18×10⁻³, T(1.92×10⁵) = −687.58, p < 2.2×10−308; history-congruence: β = −0.83 ± 1.27×10⁻³, T(1.92×10⁵) = −652.11, p < 2.2×10−308). (E) The distribution of phase shift between fluctuations in simulated stimulus- and history-congruence peaked at half a cycle (π denoted by dotted line). The dynamic probabilities of simulated stimulus- and history-congruence were therefore were strongly anticorrelated (β = −0.03 ± 8.22×10⁻⁴, T(2.12×10⁶) = −40.52, p < 2.2×10−308). (F) The average squared coherence between fluctuations in simulated stimulus- and history-congruence (black dotted line) amounted to 6.49 ± 2.07×10⁻³%. (G) Simulated confidence was enhanced for stimulus-congruence (β = 0.03 ± 1.71×10⁻⁴, T(2.03×10⁶) = 178.39, p < 2.2×10−308) and history-congruence (β = 0.01 ± 1.5×10⁻⁴, T(2.03×10⁶) = 74.18, p < 2.2×10−308). (H) In analogy to humans, the simulated data showed a quadratic relationship between the mode of perceptual processing and posterior certainty, which increased for stronger external and internal biases (β2 = 31.03 ± 0.15, T(2.04×10⁶) = 205.95, p < 2.2×10−308). The horizontal and vertical dotted lines indicate minimum posterior certainty and the associated mode, respectively.

