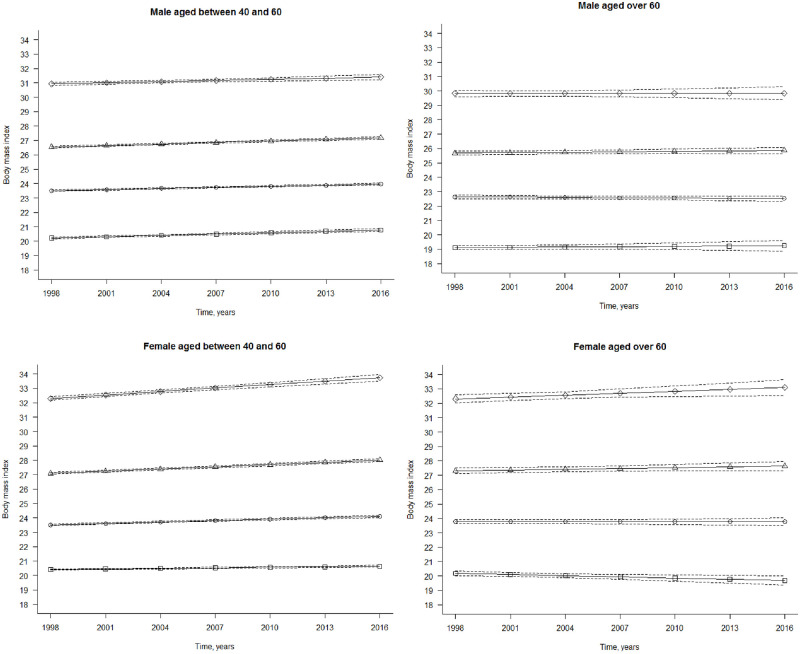
Fig 2. Body mass Índex trajectòries for the 4-group model over 19 years, adults from MJ cohort, 1998–2017.
Solid Unes indícate the mean valúes of body mass índex (weight (kg)/height (m)2) for members in the groups; dashed lines, 95%confidence intervals, (a) Male aged between 40 and 60. The trajectòries are as follows (from top to bottom): diamond, obesity, increasing; triangle, overweight, increasing; circle, mid-normal weight, increasing; square, low-normal weight, increasing. (b) Male aged over 60. The trajectòries are as follows: diamond, obesity, stable; triangle, overweight, stable; circle, mid-normal weight, stable; square, low-normal weight, stable. (c) Female aged between 40 and 60. The trajectòries are as follows: diamond, obesity, increasing; triangle, overweight, increasing; circle, mid-normal weight, increasing; square, low-normal weight, increasing. (d) Female aged over 60. The trajectòries are as follows: diamond, obesity, increasing; triangle, overweight, stable; circle, mid-normal weight, stable; square, low-normal weight, stable.

