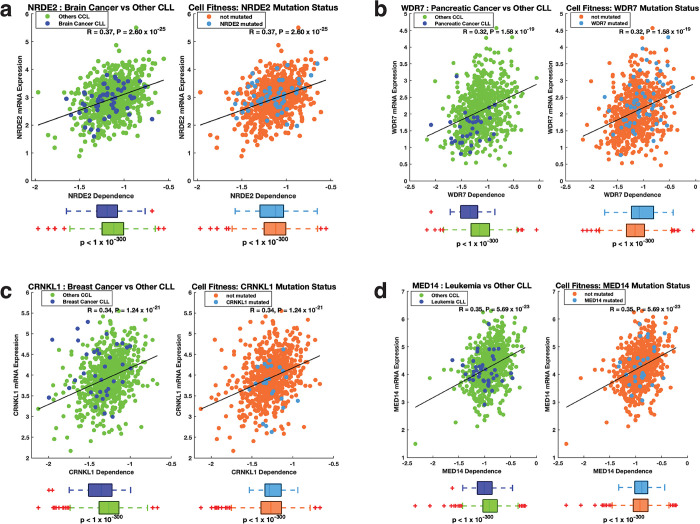
Fig 4. Relationship between gene essentiality and mRNA expression.
A. From left to right: correlation between NRDE2 transcript levels and NRDE2 gene dependence scores, the mean difference in NRDE2 dependence between brain cancer cell lines and all other cancer cell lines, and the mean difference in NRDE2 dependence score between NRDE2 mutant cell lines and cell lines that do not harbour NRDE2 mutations. B. (Left) Correlation between WDR7 transcript levels and WDR7 dependence scores, and the mean difference in WDR7 dependence scores between pancreatic cancer cell lines and all other cancer cell lines. (Right) The mean difference in the WDR7 dependence score between WDR7 mutant cell lines and cell lines that did not harbour WDR7 mutations. C. (Left) correlation between CRNKL1 transcript levels and CRNKL1 dependence scores, and the mean difference in the CRNKL1 dependence score between breast cancer cell lines and all other cancer cell lines. (Right) The mean difference in the CRNKL1 dependence score between CRNKL1 mutant cell lines and cell lines that did not harbour CRNKL1 mutations. D (Left) correlation between MED14 transcript levels and MED14 dependence scores, and the mean difference in the MED14 dependence score between leukaemia cell lines and all other cancer cell lines. (Right) The mean difference in the MED14 dependence score between MED14 mutant cell lines and cell lines that do not harbour MED14 mutations.

