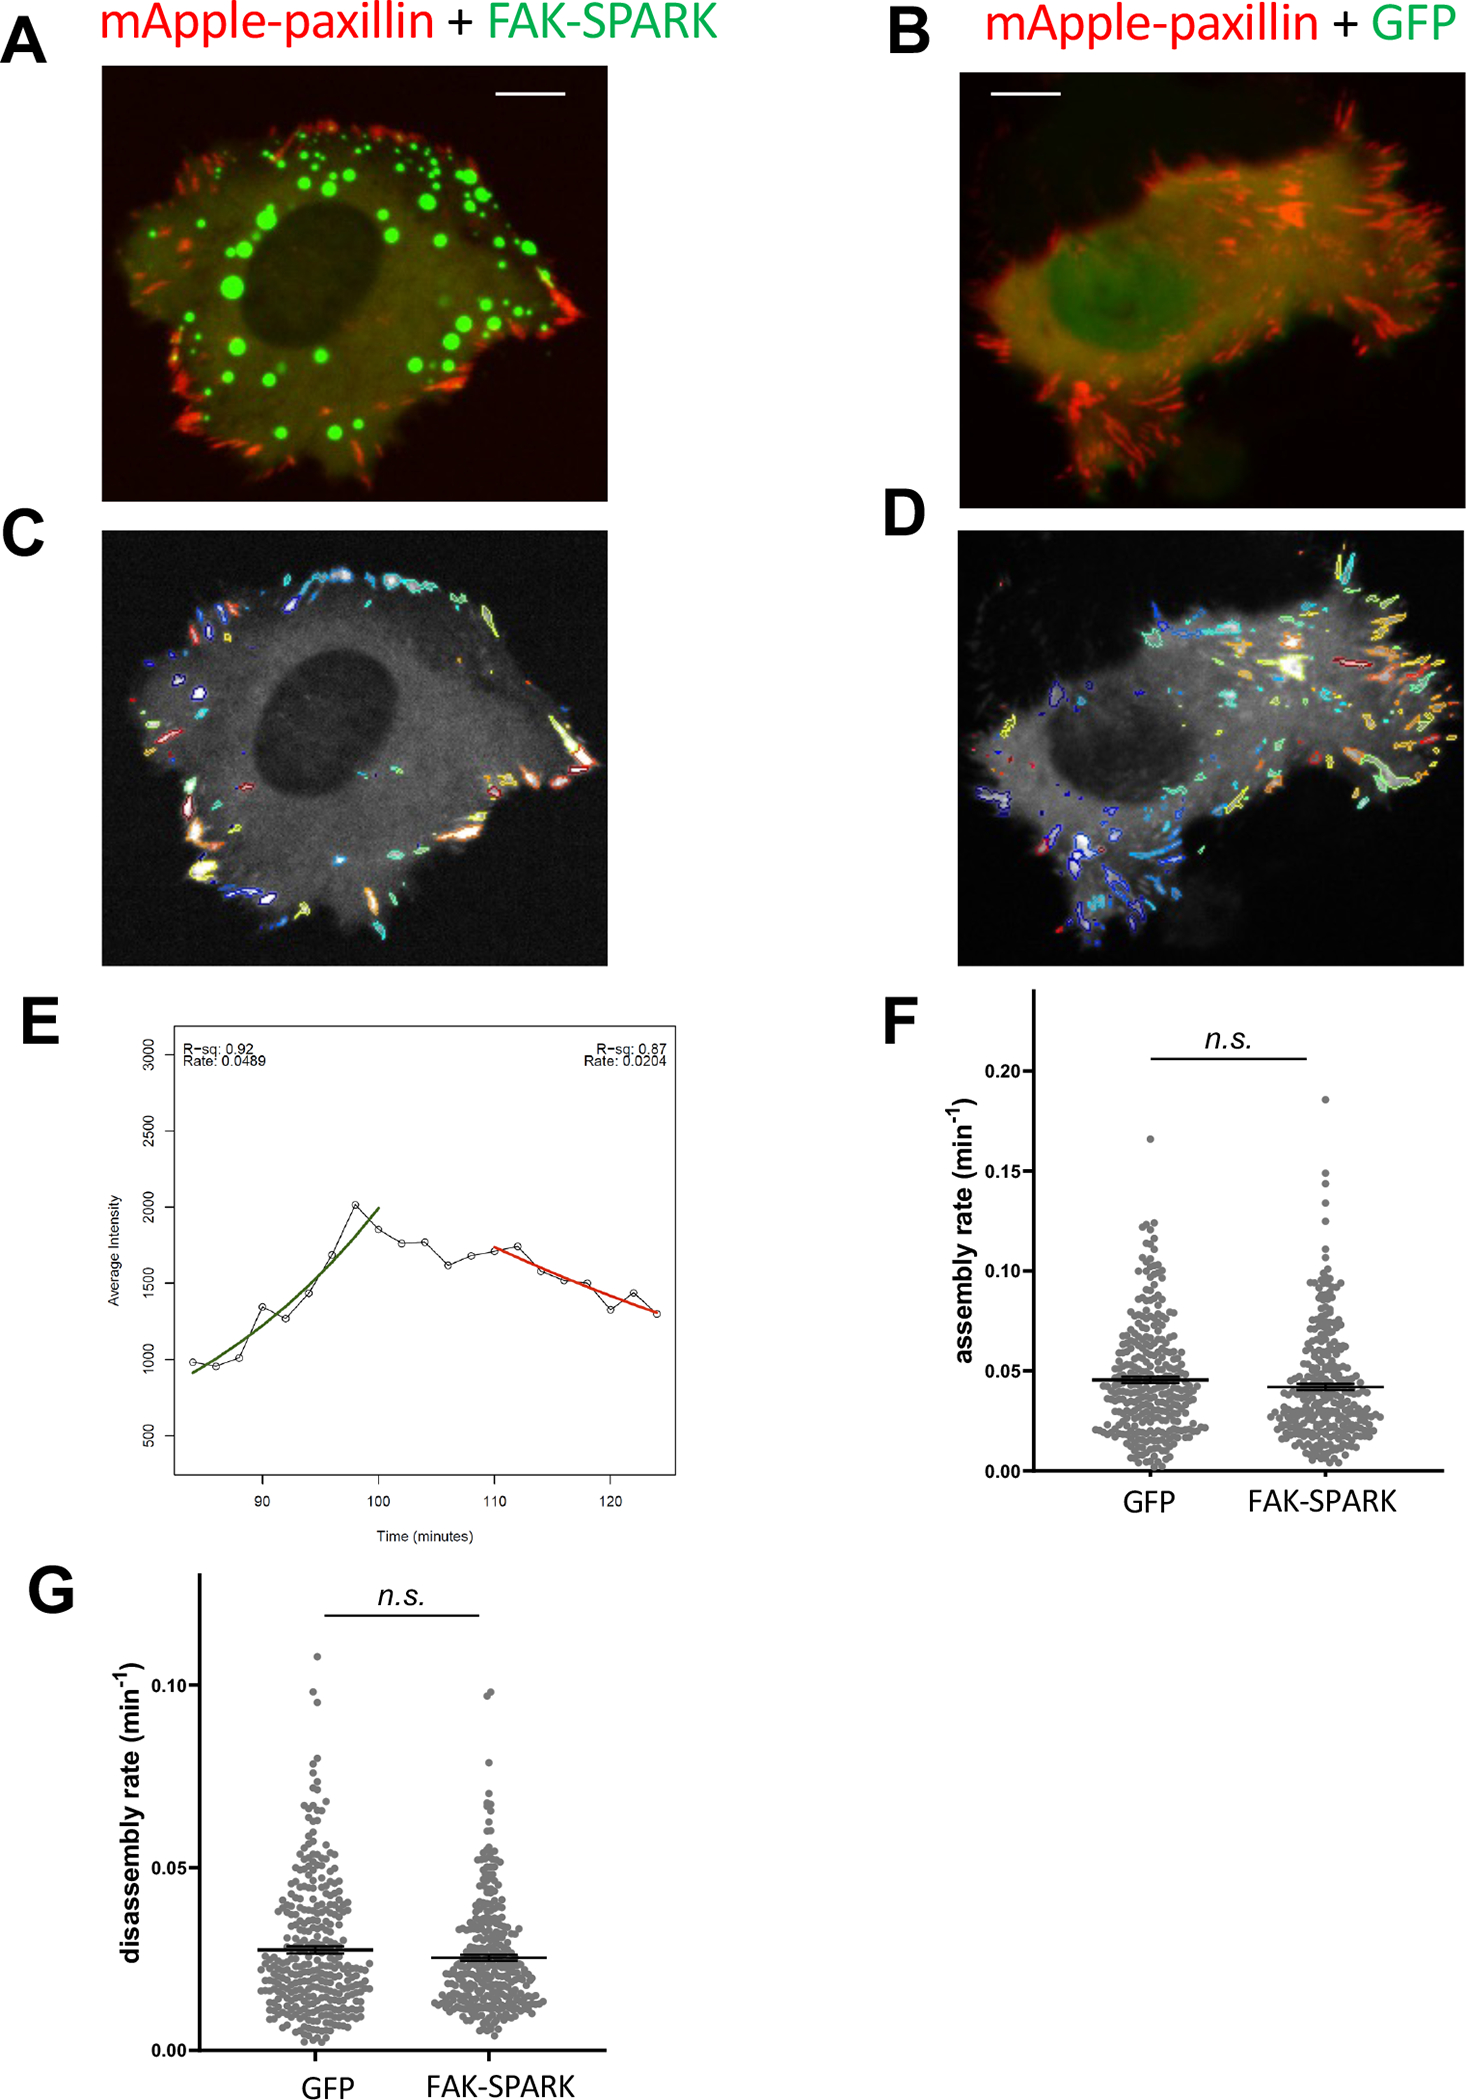
Extended Data Fig.4. FAK-SPARK expression does not perturb dynamics of focal adhesion assembly and disassembly.

A & B, Representative images of HeLa cells expressing mApple-paxillin + FAK-SPARK and mApple-paxillin + GFP, respectively. C & D, Tracking of FAs using Focal Adhesion Analysis Server {Steenkiste:2021iv, Berginski:2013dj} in A & B. E, A typical trace of assembly and disassembly rate calculation. F & G, Assembly rate and disassembly rate in HeLa cells expressing FAK-SPARK or GFP. Data represent mean ± SE (n ~300 focal adhesions) n.s., not significant. Scale= 10 μm.
