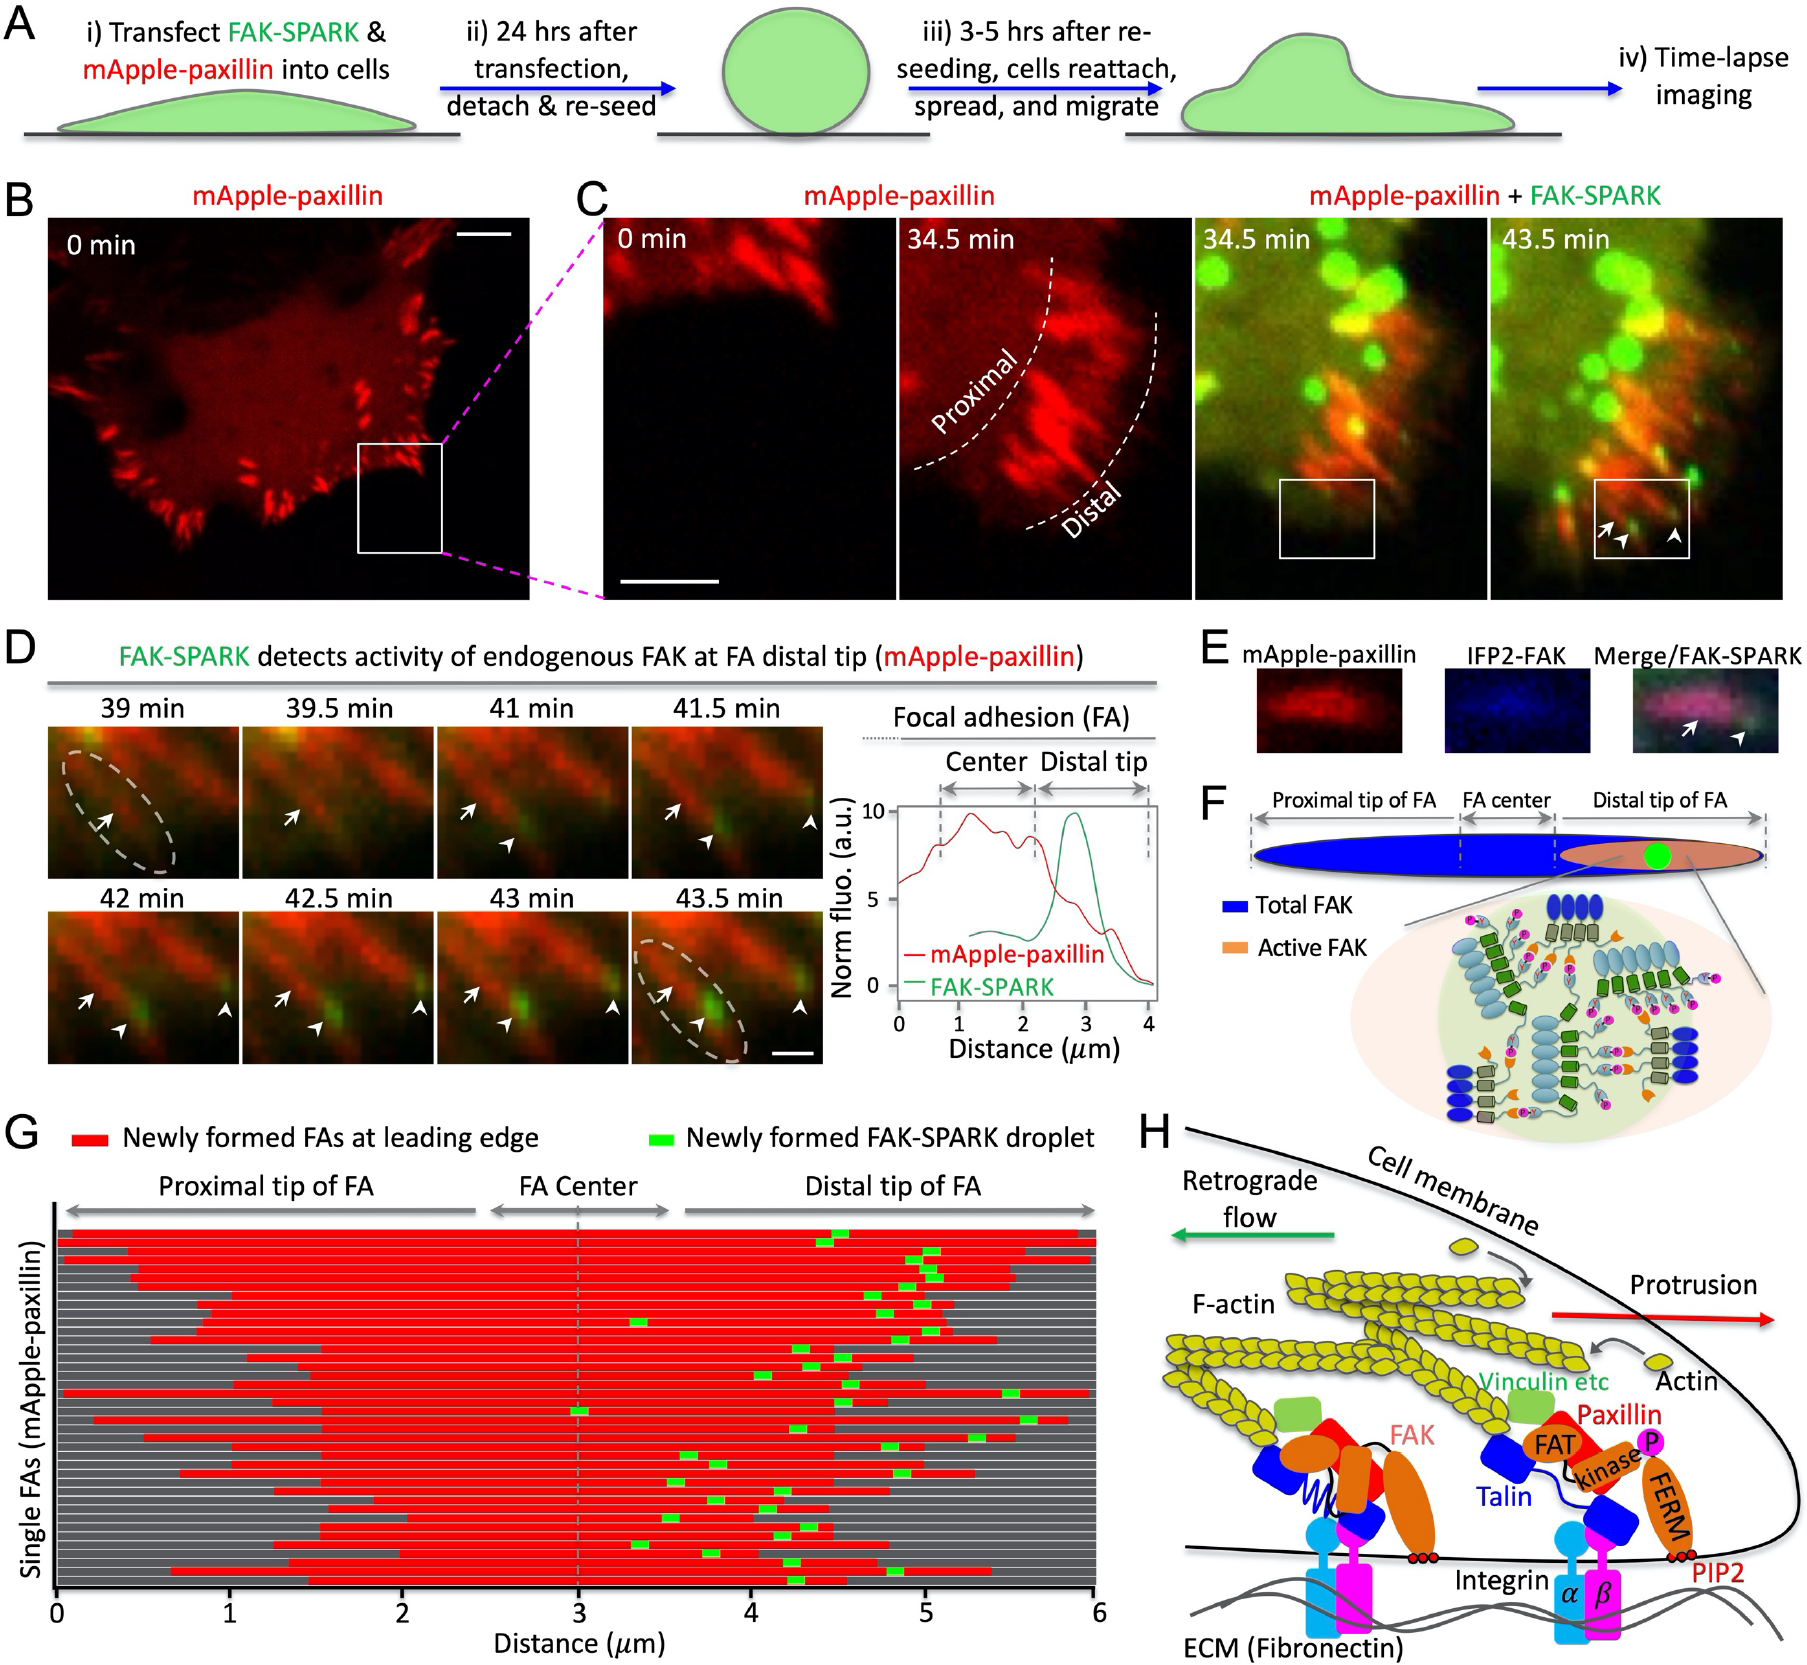
Fig. 4. FAK activity is polarized at the distal tip of newly formed focal adhesions in the leading edge.

(A) Experimental procedure. (B, C) Time-lapse images of cells expressing mApple-paxillin and FAK-SPARK. (D) Left: fluorescence images of the boxed area in (c). Right: normalized fluorescence intensity over distance along the single FA (dashed box at 43.5 min). (E) Fluorescence images. (F) Cartoon showing distribution of total FAK and activated FAK within single FAs. (G) Distribution of newly formed FAK-SPARK droplets in single FAs at the leading edge. (H) Proposed model showing polarized FAK activation in single FAs at the leading edge of a migrating cell. Scale bar, (B) 10 μm; (C) 5 μm; (D) 1 μm.
