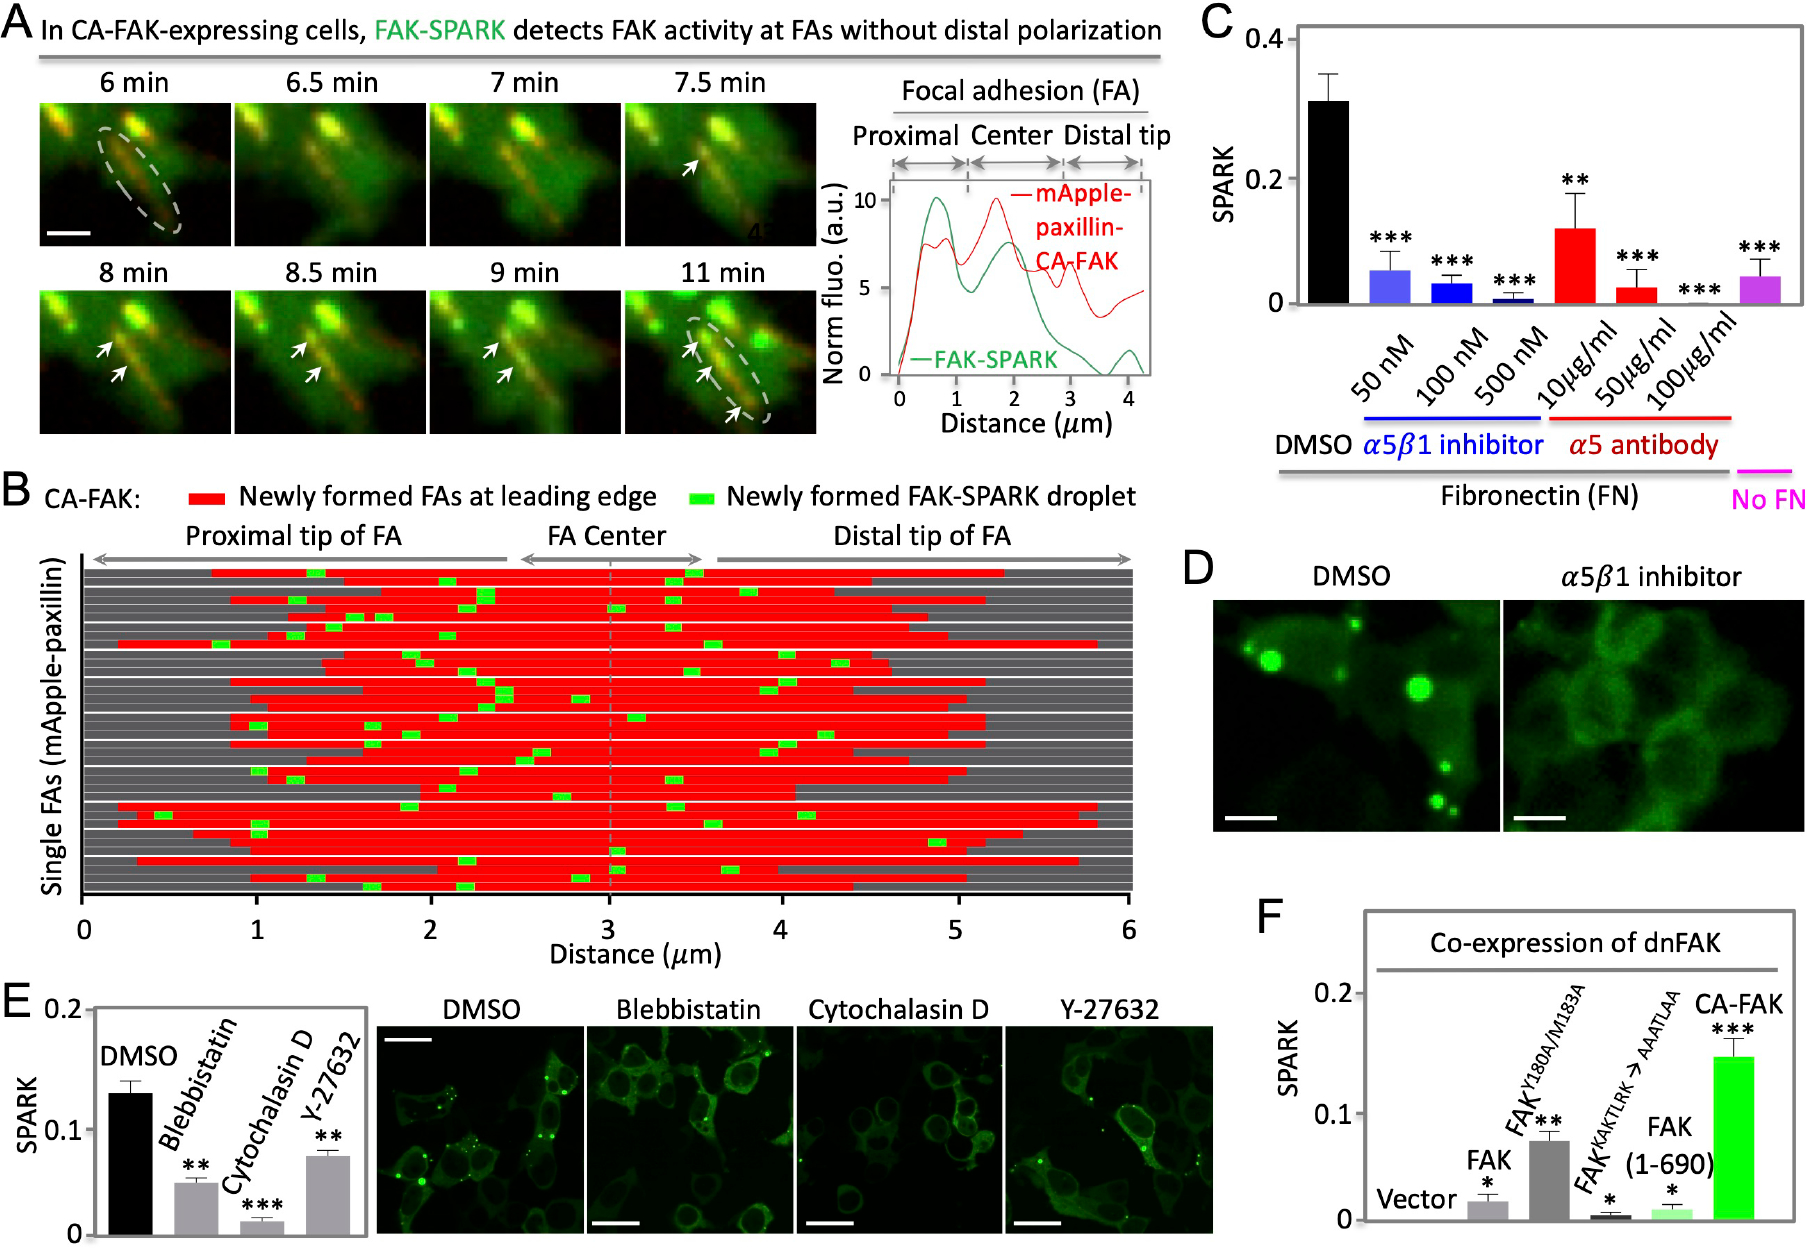
Fig. 5. Polarization of FAK activity depends on FERM domain, integrin and actin cytoskeleton.

(A) Left: fluorescence images showing no distal polarization of FAK activity when CA-FAK is fused to paxillin and targeted to focal adhesions in cells with endogenous FAK knocked down by shRNA against FAK (Details in text). Right: normalized fluorescence over distance along the single FA (boxed area at 11 min). (B) Distribution of newly formed FAK-SPARK droplets in single FAs at the leading edge. (C) Normalized SPARK signal in cells incubated with integrin inhibitors or antibodies. Cells were grown on fibronectin. (D) Representative images of cells expressing FAK-SPARK, incubated with DMSO or integrin inhibitor. (E) Left: normalized SPARK in cells incubated with inhibitors of myosin II, actin polymerization, and ROCK. Right: Representative images (F) Normalized SPARK in cells expressing various FAK mutants. The cells co-expressed dominant negative FAK (dnFAK), and FAK-SPARK. Data are mean ± SEM (n = 3 or 4 biological replicates). *: p value < 0.05. **: p value < 0.01. ***: p value < 0.001. Scale bar, 1 μm (A); 10 μm (D); 15 μm (E).
