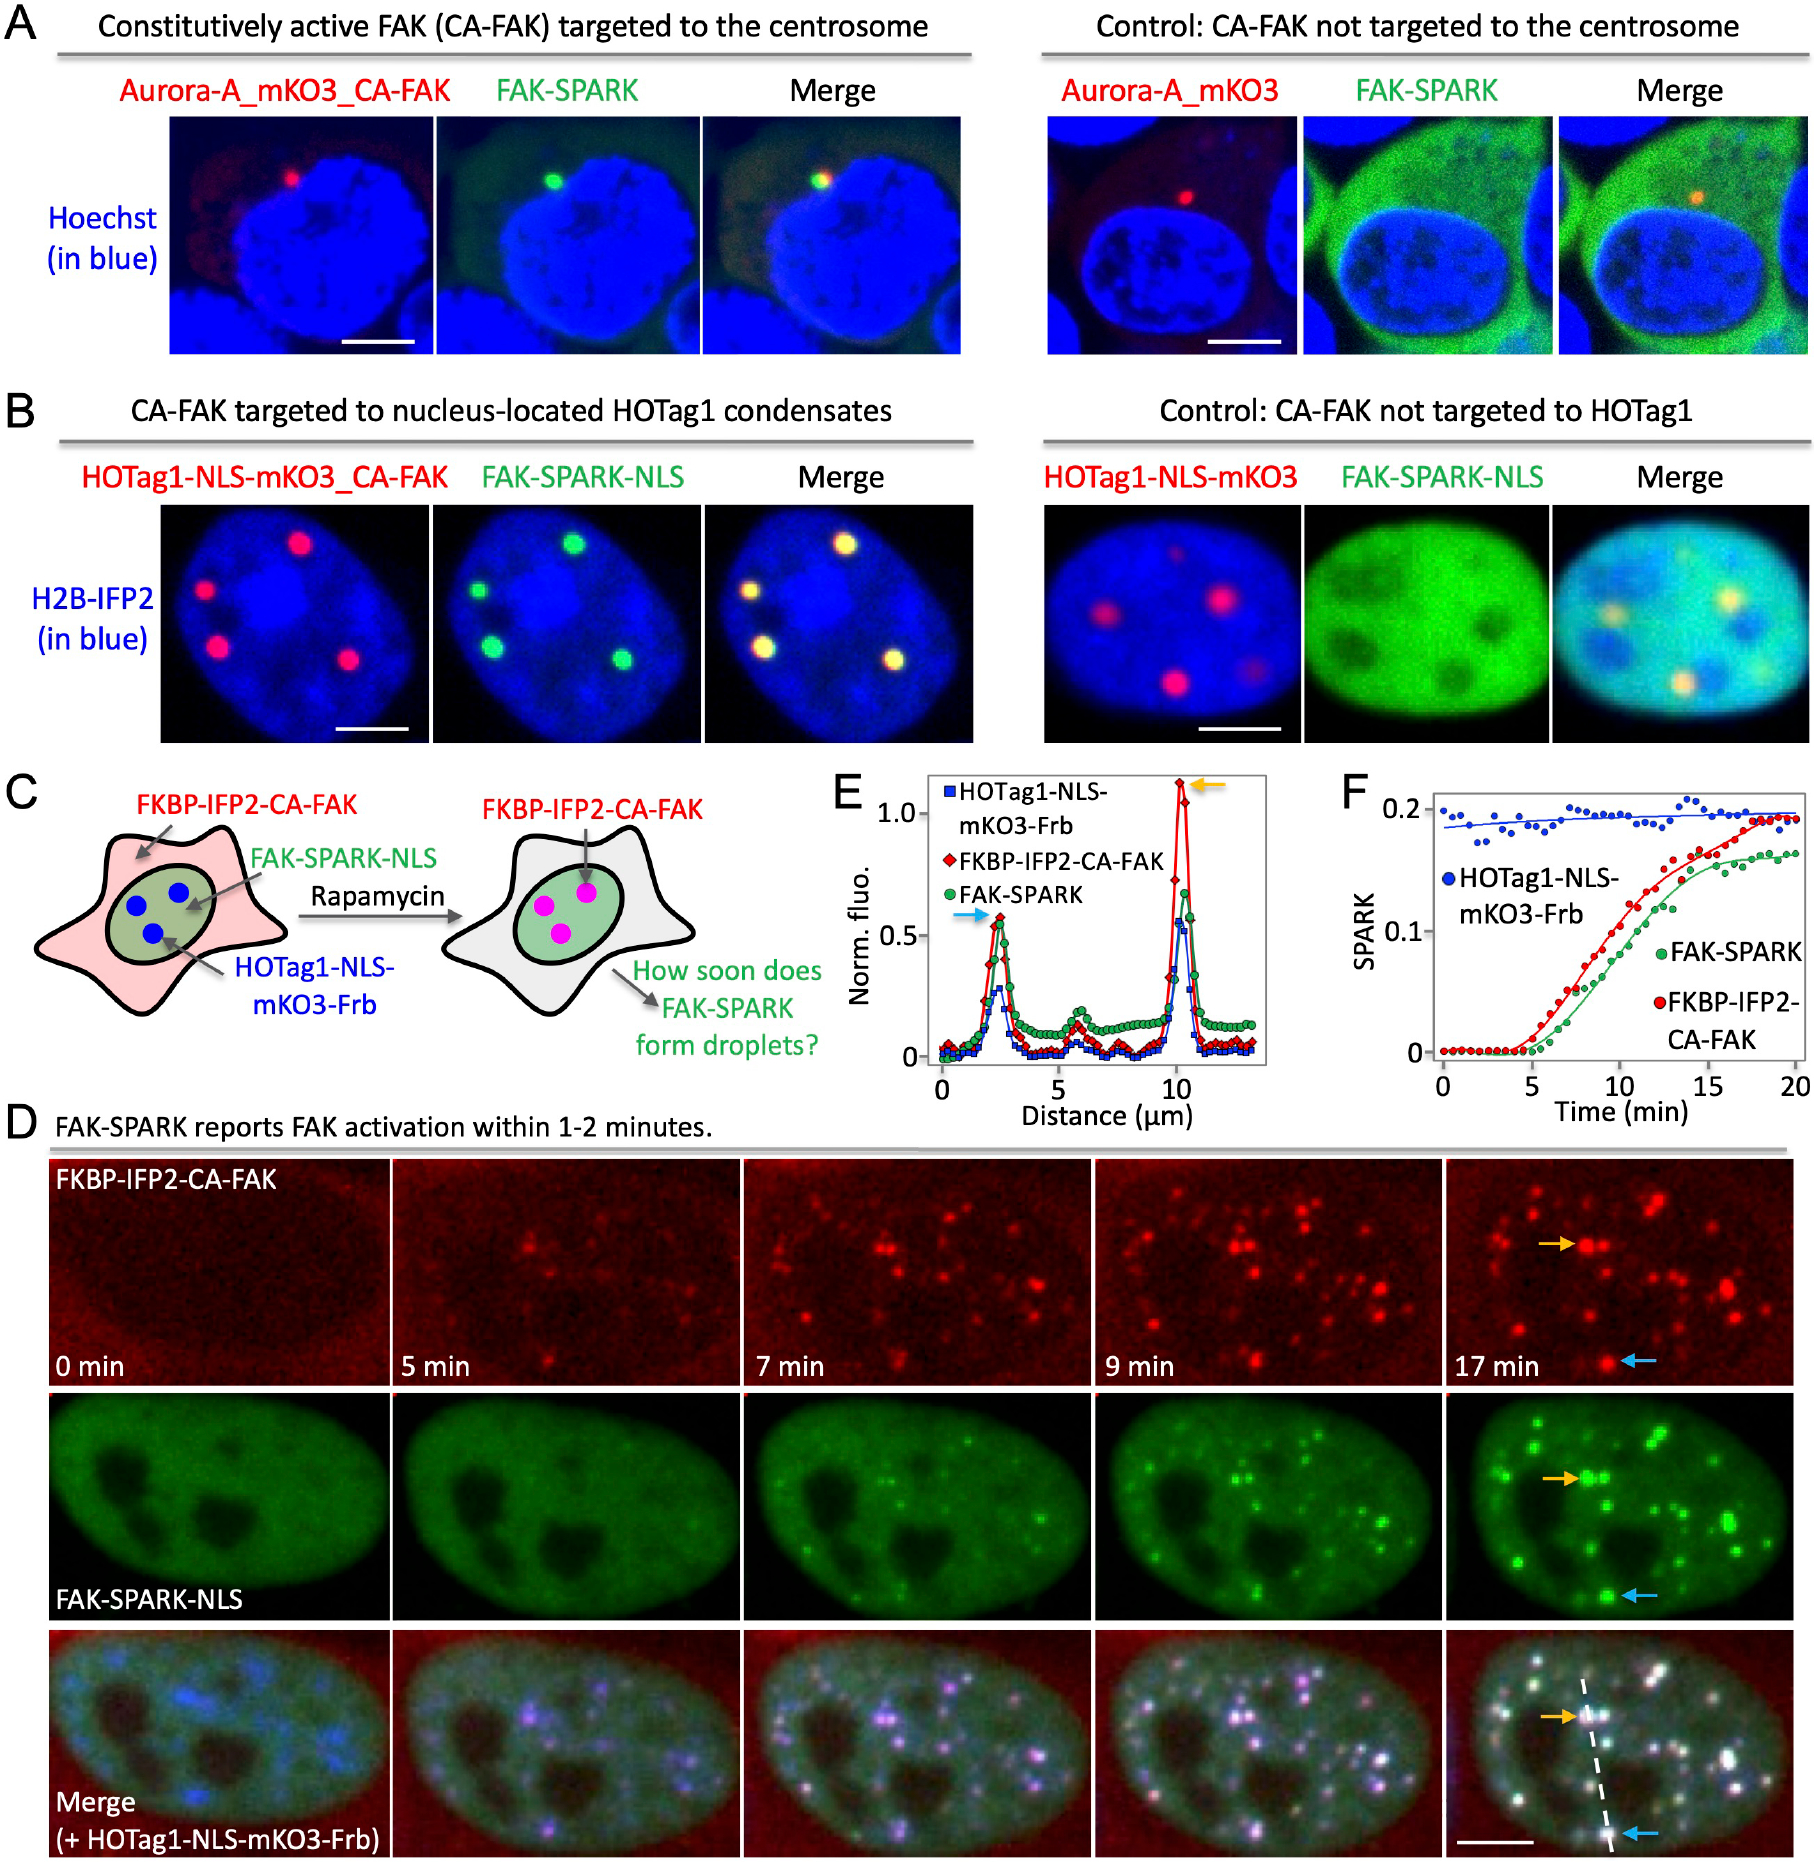
Extended Data Fig.3. FAK-SPARK visualizes FAK activity with spatiotemporal resolution by targeting active FAK into specific locations.

(A) Fluorescence images showing that FAK-SPARK visualizes FAK activity in the centrosome when constitutively active FAK (CA-FAK) is fused to aurora A kinase that is located in the centrosome (left panels). FAK activity is absent in the centrosome without CA-FAK (right panels). (B) Fluorescence images showing that nucleus-located FAK-SPARK-NLS (nuclear localization signal) visualizes FAK activity in the nuclear HOTag1 condensates that are tagged with CA-FAK (left panels). FAK activity is absent the CA-FAK-absent HOTag1 condensates. (C) Cartoon showing experimental procedure of measuring FAK-SPARK temporal resolution. (D) Time-lapse images after addition of rapamycin. (E) Normalized fluorescence along the dash line in (D). (F) Normalized SPARK signal over time. Scale bar, 5 μm (A, B, D).
