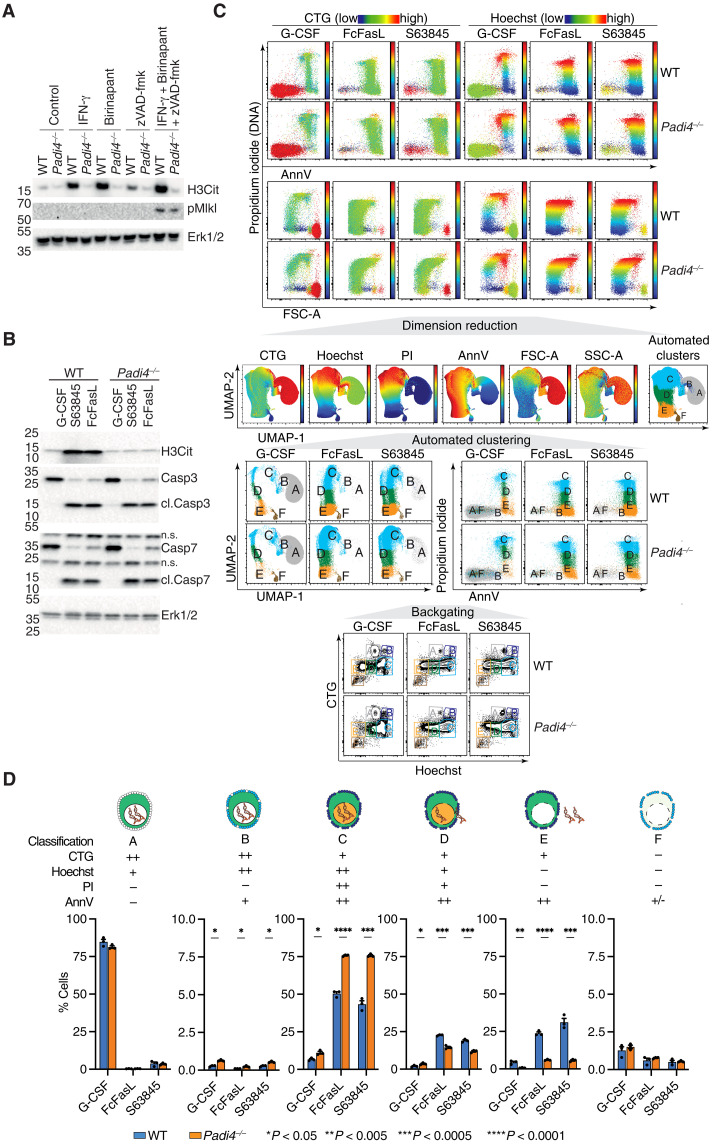
Fig. 1. PAD4 is activated by apoptotic and necroptotic stimuli and controls cytoplast formation.
(A and B) Protein expression levels of H3Cit, pMLKL, (cl.) caspase 3, and Erk1/2 in freshly isolated WT and Padi4−/− BM neutrophils stimulated with apoptotic and necroptotic stimuli. (C) Flow cytometry evaluation of cell size (FSC-A) and granularity (SSC-A), propidium iodide (PI), annexin V (AnnV), CellTracker Green (CTG), and Hoechst in WT and Padi4−/− neutrophils stimulated as indicated. (D) Statistical analysis of the proportion of each cell cluster identified by dimension reduction (UMAP) and automated clustering (FLOWSOM) from (C). Means ± SEM, n = 3 in each stimuli group, *P < 0.05, **P < 0.005, ***P < 0.0005, ****P < 0.0001, WT versus Padi4−/−, unpaired t test. n.s., not significant.

