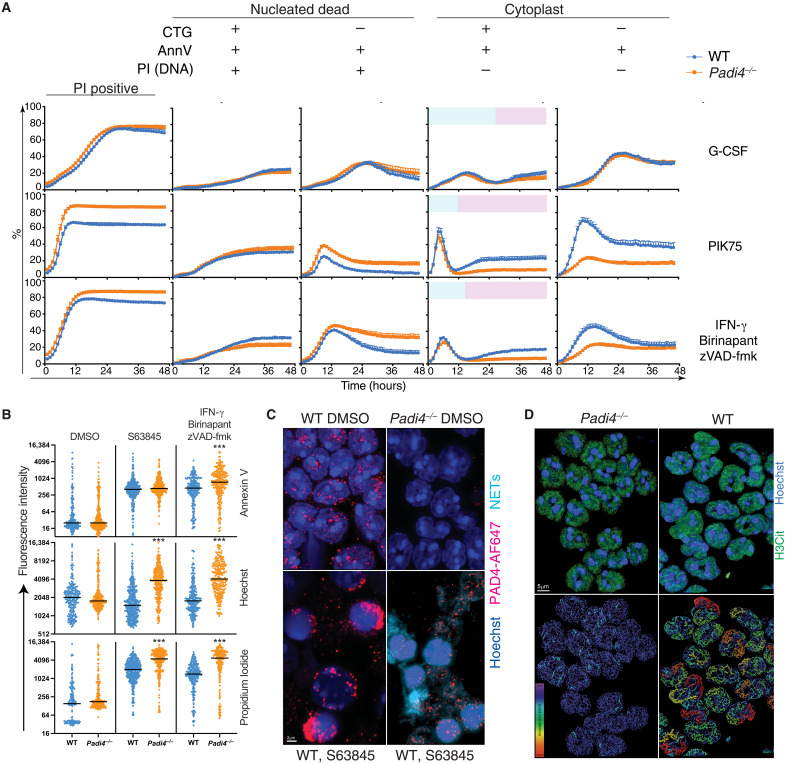
Fig. 2. PAD4 mediates cytoplast formation after disruption of plasma membrane integrity.
(A) Kinetic changes in WT and Padi4−/− neutrophil viability in 48-hour live-cell imaging in the presence of G-CSF (100 ng/ml), 1 μM PIK75, or combinations of 2 μM BPT, 10 μM zVAD-fmk, and IFN-γ (100 ng/ml). Data represent mean and SEM of independent biological samples from five WT and seven Padi4−/− mice. Blue color in column 4 represents dying neutrophils. Pink color in column 4 represents dead neutrophils lacking a nucleus (cytoplast). (B) Quantitative fluorescence intensity of WT and Padi4−/− neutrophils at 12 hours classified according to staining with Hoechst, CTG, PI, and AnnV. ***P < 0.0001, WT versus Padi4−/−. (C) Fluorescence microscopy showing externalized DNA from neutrophils treated with S63845. Neutrophils were stained with Hoechst and a PAD4 antibody coupled to AF647. A 3D nuclear mask was generated to identify DNA outside the nuclear outline to separate intranuclear (dark blue) from extranuclear (aqua) DNA (NETs). (D) Super-resolution microscopy of H3Cit distribution in WT and Padi4−/− neutrophils indicating the difference in intensity and distribution of signal. A bounding box metric indicates the continuity of H3Cit signal by assessing the length of the longest principal axis inside a rectangular cuboid object and whose local axes are aligned along the principal axis of the object. Data are representative of three independent experiments.

