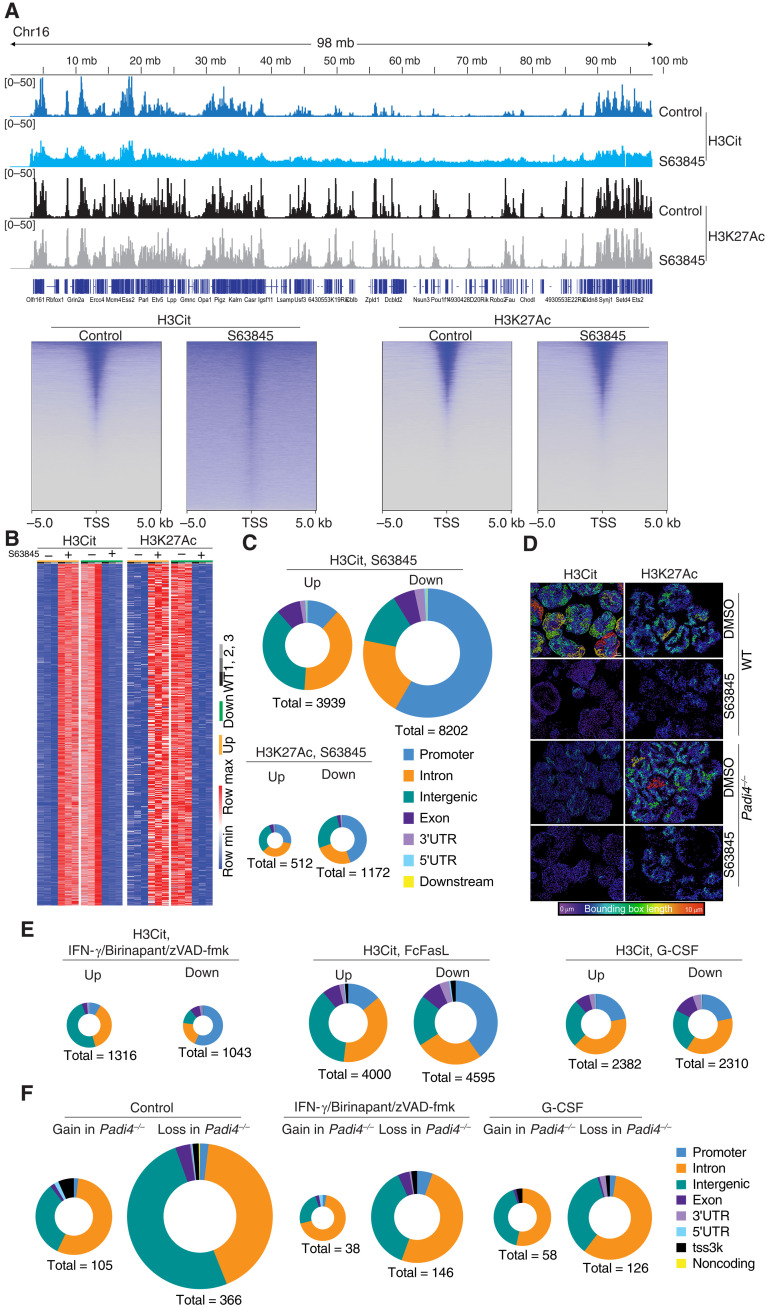
Fig. 3. Cell death–triggered epigenetic changes in dying neutrophils.
(A) Top: Genome tracks of H3Cit and H3K27Ac of WT and Padi4−/− control neutrophils or treated with S63845 and analyzed using CUT&Tag. Data representative to three biological replicates. Bottom: Heatmap representation of WT neutrophil H3Cit and H3K27Ac at the TSS following S63845 treatment for 2.5 hours. (B) Heatmap representation of unique differential H3Cit or H3K27Ac peaks at specific genomic loci using CUT&Tag in independent samples of neutrophils treated with S63845 for 2.5 hours or controls. (C) Genomic feature analysis of H3Cit and H3K27Ac differential peaks in WT neutrophils treated with S63845 and analyzed by CUT&Tag. (D) Super-resolution microscopy of H3Cit and H3K27Ac distribution in WT and Padi4−/− neutrophils treated with S63845 and controls. A bounding box metric indicates the continuity of signal. (E) Genomic feature analysis of H3Cit CUT&Tag signal in WT neutrophils treated with S63845, IFN-γ + birinapant + zVAD-fmk, FcFasL, or G-CSF. (F) ATAC-seq evaluation of differential chromatin accessibility in freshly isolated WT and Padi4−/− control neutrophils or treated with G-CSF or IFN-γ + birinapant + zVAD-fmk. 3′UTR, 3′ untranslated region.

